eBPF Lab: Experiments
Perform an action, predict the signal, then check the dashboard and explain what changed (eBPF Lab lab).
Seven experiments, from “see that it works” to “delete the cluster”. Each is one make target, a prediction to make before you run it, and screenshots from a real run. Two of them didn’t behave the way the lab’s first design said they would, and those are the most useful ones: OBI’s trace context only joins services on the same node, and Falco never sees a download that Tetragon stops.
How to Run an Experiment
The loop is the same each time:
- Read the goal and answer the Predict question before you look.
- Run the action:
make exp-<id>(each card shows the exact target). - Wait the stated time. Flows and security events take seconds; traces up to a minute; OBI’s metrics 90 seconds (Signal Timing).
- Look where the card says, then run
make verify-<id>: it exits 0 only if the expected signal exists. - Explain what you saw, then compare with the sections under each card.
Every screenshot here was captured on 2026-10-14, from lab revision c948ded, by the blog’s capture script, which runs the same exp- and verify- targets and only keeps a shot when the verify passed. Experiments 1 to 5 ran on one cluster and Experiment 7 then rebuilt it; Experiment 6’s shots were retaken afterwards, on the rebuilt cluster, with a longer wait.
Experiment 1: See every flow without kube-proxy
Send traffic through web, api and redis and see each hop in Hubble, with Cilium’s eBPF doing the service load balancing that kube-proxy used to do.
Send 120 requests through the app.
make exp-cilium-cniThere is no kube-proxy and no iptables service rules. How does a request to the api ClusterIP reach a pod, and on which node?
| Signal | Where | Query | What you should see |
|---|---|---|---|
| events | Hubble UI › namespace demo | hubble observe --namespace demo | web → api → redis edges, with flows to the api pod on the other node marked to-overlay (VXLAN). |
| metrics | cilium-dbg service list | cilium-dbg service list | The api ClusterIP with two backends, translated in eBPF on each pod’s veth. |
What the screenshots show
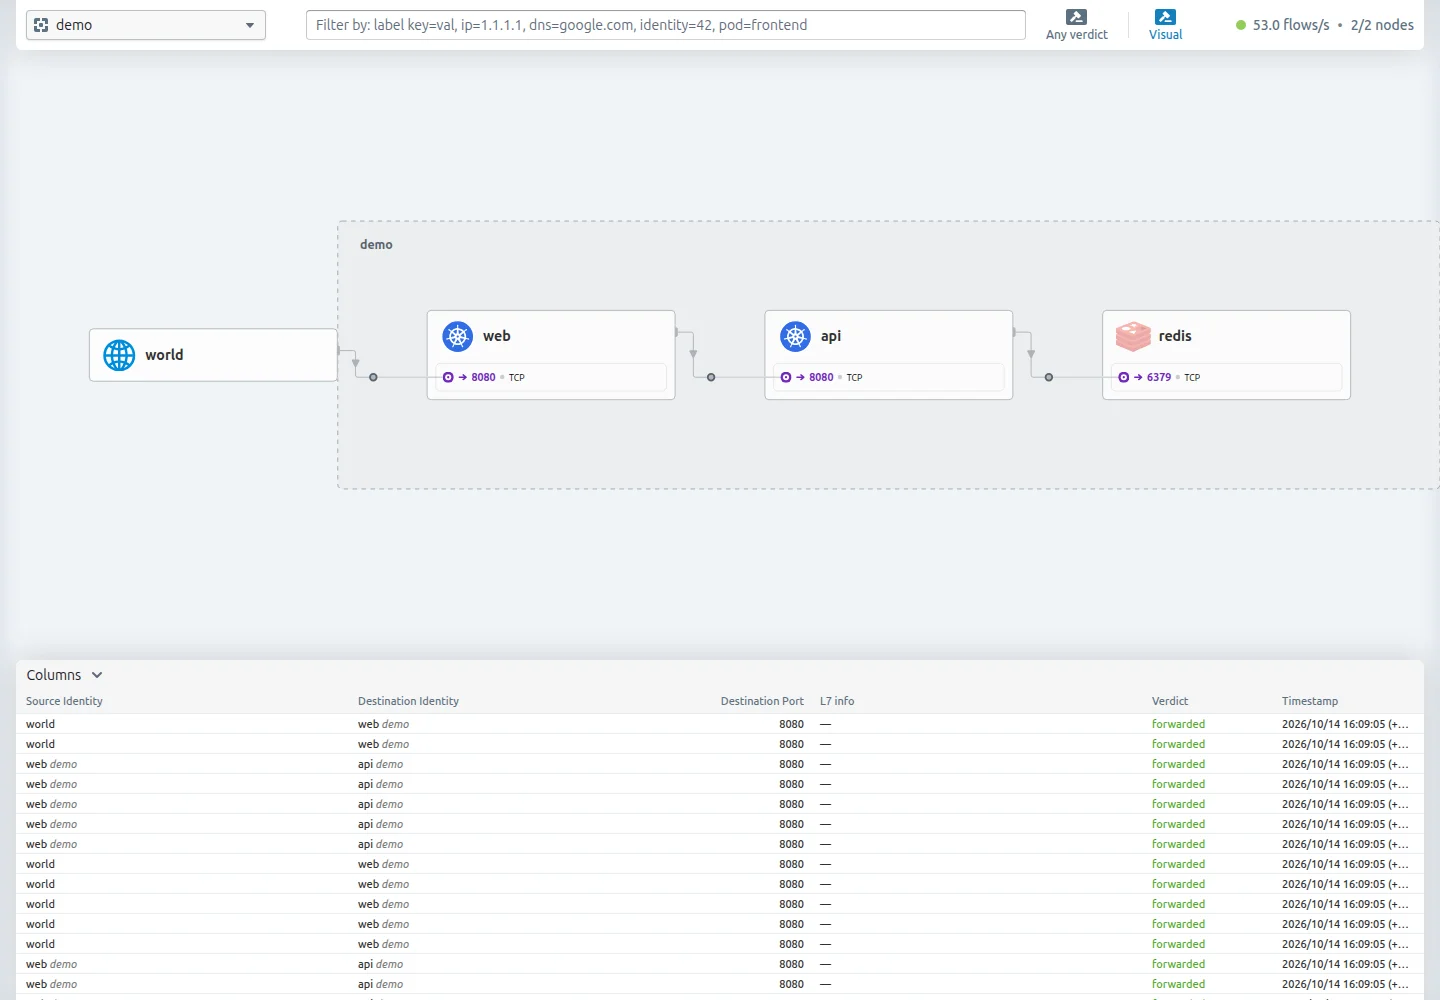
Hubble’s service map for namespace demo is drawn from packets alone: world (the host, through the NodePort) → web on 8080/TCP → api on 8080/TCP → redis on 6379/TCP. The header shows 53.0 flows/s across 2/2 nodes, and the flow table below lists world → web 8080 forwarded and web → api 8080 forwarded rows at 16:09:05, all from the burst. (In some runs the map draws the two api pods as two boxes; here it grouped them.)
The hubble observe side of the card shows the answer to “on which node?”. In the rebuilt cluster, four visits in a row gave:
1
2
3
demo/web-57fbb6bb9f-zcggd:53798 (ID:33136) -> demo/api-5df5d59bd7-vss5p:8080 (ID:57017) to-endpoint FORWARDED (TCP Flags: SYN)
demo/api-5df5d59bd7-vss5p:51274 (ID:57017) -> demo/redis-bcc8fb84b-m6nfd:6379 (ID:7726) to-endpoint FORWARDED (TCP Flags: SYN)
demo/web-57fbb6bb9f-zcggd:53818 (ID:33136) -> demo/api-5df5d59bd7-lhbhh:8080 (ID:57017) to-overlay FORWARDED (TCP Flags: SYN)
to-endpoint is delivery to a pod on the same node; to-overlay means the packet left through the VXLAN tunnel to the other node. Both api pods carry the same identity (57017): identity comes from labels, not from the pod.
Why it happens
When nginx connects to api:8080, it connects to the Service’s ClusterIP. With kubeProxyReplacement: true, Cilium’s eBPF program on the web pod’s veth rewrites that destination to one backend from its Service map before the packet goes anywhere, so no iptables rule is involved (the nodes have zero KUBE-SVC rules; Part 4). The map is what cilium-dbg service list prints:
1
2
3
4
ID   Frontend                  Service Type   Backend
26   10.101.88.112:8080/TCP    ClusterIP      1 => 10.100.0.201:8080/TCP (active)
                                              2 => 10.100.1.59:8080/TCP (active)
27   0.0.0.0:30091/TCP         NodePort       1 => 10.100.0.205:8080/TCP (active)
The pod addresses tell you the node: 10.100.0.x is the server’s pod range, 10.100.1.x the agent’s. Because the API opens a new connection per request, consecutive requests can pick different backends, and roughly half cross the tunnel. Hubble sees each step because the same datapath that forwards a packet also records it.
Experiment 2: Drop a connection by identity
Allow only api pods to talk to redis and watch Cilium drop web’s direct connection in eBPF, while the app keeps working.
Apply the policy, then try to reach redis from the web pod.
make exp-identity-policyThe web pod and the api pods share a node network. What does Cilium check to tell them apart?
| Signal | Where | Query | What you should see |
|---|---|---|---|
| events | Hubble UI › namespace demo, then the flows table | hubble observe --namespace demo --verdict DROPPED | web → redis:6379 with verdict DROPPED and reason Policy denied, repeated for each SYN retry; api → redis still FORWARDED. |
What the screenshots show
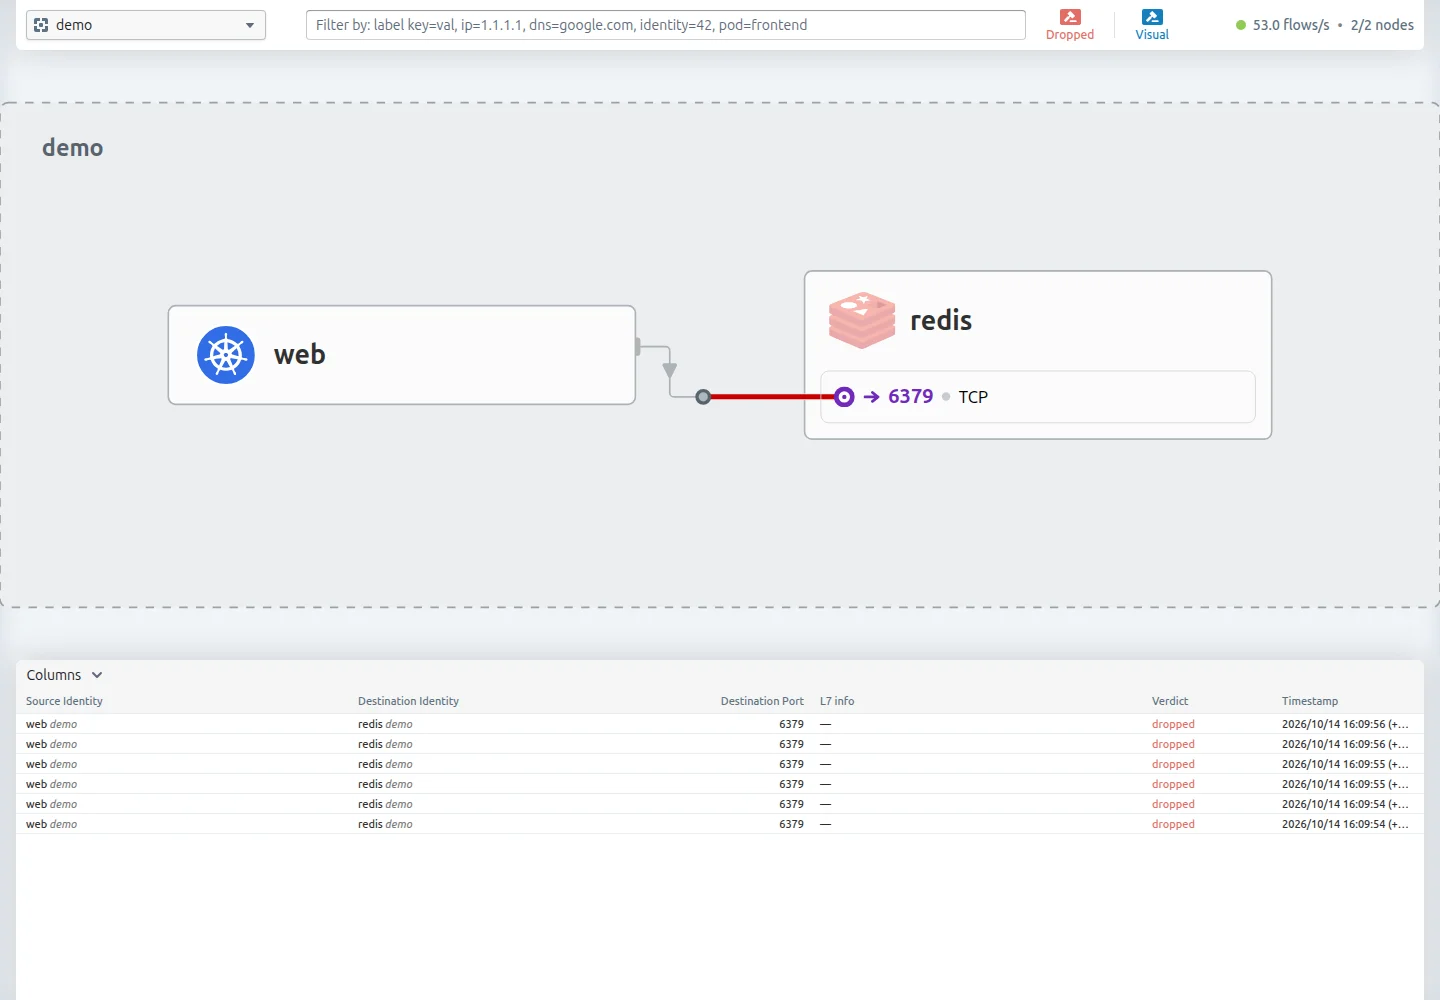
With the verdict filter set to Dropped, the map shrinks to one edge, drawn red: web → redis 6379/TCP. The table has six rows, all web demo → redis demo 6379 dropped, at 16:09:54–16:09:56. The action’s own output, in the terminal, shows both halves of the result:
1
2
web->redis blocked
app via api->redis: ok
And the verify target finds the drop with its reason (this line is from an earlier run of the same experiment; identities are assigned per cluster):
1
demo/web-57fbb6bb9f-bq4v6:33095 (ID:19920) <> demo/redis-bcc8fb84b-8cwqc:6379 (ID:33229) Policy denied DROPPED (TCP Flags: SYN)
To the prediction: Cilium told the pods apart by numeric security identities, not by IP address. In the run that line comes from, web was identity 19920 and redis 33229; the api pods had one of their own.
Why it happens
k8s/policies/redis-from-api-only.yaml is an ordinary L3/L4 CiliumNetworkPolicy:
1
2
3
4
5
6
7
8
spec:
  endpointSelector:
    matchLabels: {app: redis}
  ingress:
    - fromEndpoints:
        - matchLabels: {app: api}
      toPorts:
        - ports: [{port: "6379", protocol: TCP}]
Once a policy selects the redis pod, everything it doesn’t allow is denied. Cilium gives every set of pod labels a numeric identity and carries the sender’s identity with each packet (inside the VXLAN header when it crosses nodes). The eBPF program in front of redis checks that identity against the policy and drops the SYN before redis sees it. nc -w 3 retried the SYN, which is why the table shows several drops for one attempt.
One side effect is visible in Experiment 6’s Falco screenshot: this nc was the only command in the whole run that triggered Falco’s Network tool in demo pod rule.
Experiment 3: RED metrics from an app with no instrumentation
Let OpenTelemetry eBPF Instrumentation watch the Go API and Redis from the kernel and turn their traffic into request rate, errors and duration per route.
Send traffic, then read the HTTP and Redis metrics OBI produced.
make exp-obi-red-metricsThe API has no OpenTelemetry, no metrics library, nothing. Where can OBI get the route name /api/visits from?
| Signal | Where | Query | What you should see |
|---|---|---|---|
| metrics | Grafana (mon) › Dashboards › Labs › eBPF lab › Requests per route (or Explore, as an Editor) | sum by (http_route) (rate(http_server_request_duration_seconds_count{cluster="lab-ebpf", job=~"demo/.*"}[3m])) | /api/visits, /api/items and /healthz with their request rates, and db_client_operation_duration_seconds for the Redis INCR. |
| metrics | Grafana (mon) › Dashboards › Labs › eBPF lab | Requests per route, Latency p95, Responses by status code, Redis operations | All four OBI panels move with the burst; Redis shows INCR at the /api/visits rate. |
What the screenshots show
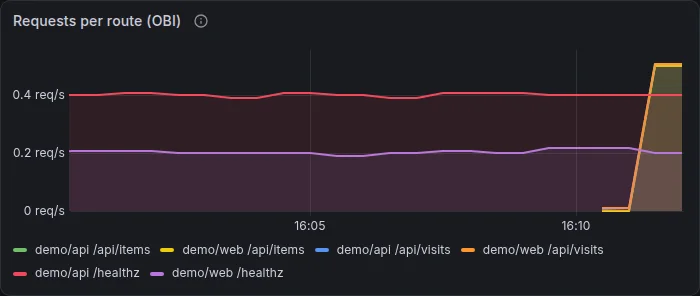
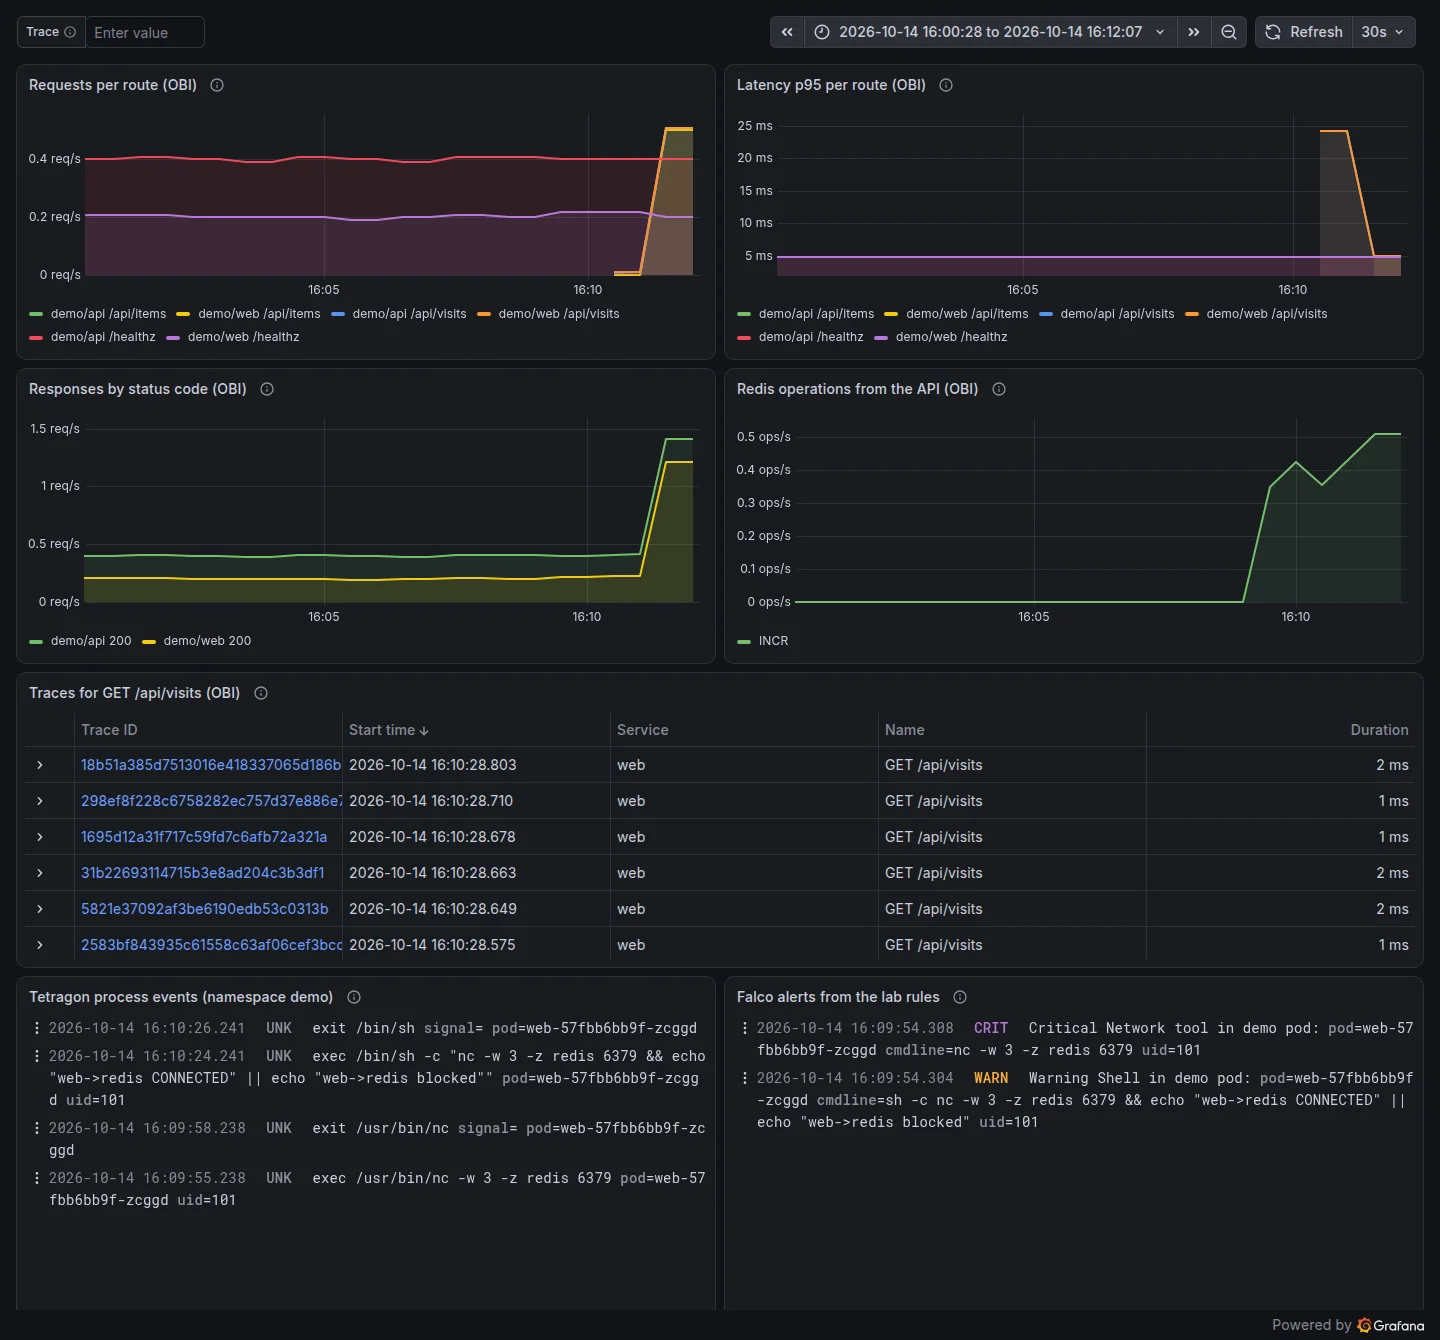
The Requests per route (OBI) panel shows the burst arriving at about 16:11: demo/api and demo/web for both /api/visits and /api/items rise from zero to about 0.5 req/s each, averaged over the 3-minute window. Underneath, two flat lines never move: demo/api /healthz at 0.4 req/s and demo/web /healthz at 0.2 req/s, the readiness probes.
The full dashboard (in Part 5) fills in the rest of RED from the same burst. Responses by status code has only 200 lines (about 1.4 req/s for the API, 1.2 for web at the peak). Latency p95 stays under 5 ms for probes and climbs to about 24 ms for demo/web /api/visits. Redis operations shows INCR at 0.5 ops/s, the same rate as /api/visits: one Redis command per visit.
The prediction asked where OBI gets the route /api/visits from. Not from the Go router: from the request line it reads off the socket.
Why it happens
OBI’s probes are attached to the processes in namespace demo (its capture rule; see Instrumentation). For each HTTP request it sees the request and response, times them, and records the method, path and status code; for Redis it parses INCR out of the RESP bytes. It turns those into the OpenTelemetry semantic-convention metrics http.server.request.duration and db.client.operation.duration, which arrive in Mimir as http_server_request_duration_seconds_* and db_client_operation_duration_seconds_*.
They arrive late: OBI pushes once a minute. That’s why this experiment waits 90 seconds and the panels use a 3-minute rate window. The first capture of this experiment, with a 30-second wait and [1m] windows, showed the previous burst and three empty panels.
Experiment 4: A trace across web, api and redis
Follow requests through nginx, the Go API and Redis as traces that OBI builds from the kernel, and find out when its trace context joins them into one trace and when it doesn’t.
Send six visits, three seconds apart, so the two api pods (one per node) both serve some.
make exp-obi-tracesNobody propagates a traceparent header in this code. Will web’s span and the api’s span end up in the same trace, whichever api pod answers?
| Signal | Where | Query | What you should see |
|---|---|---|---|
| traces | Grafana (mon) › Dashboards › Labs › eBPF lab › Traces for GET /api/visits, then Trace waterfall | { resource.k8s.cluster.name = "lab-ebpf" && resource.service.name = "web" } >> { resource.service.name = "api" } | Joined traces: demo/web GET /api/visits with demo/api’s GET /api/visits and its INCR under it, when web and that api pod share a node. |
| traces | Same panel, the rows whose Service is api | { resource.k8s.cluster.name = "lab-ebpf" && trace:rootService = "api" && trace:rootName = "GET /api/visits" } | Split traces: demo/api as the root, with INCR and demo/redis’s own INCR span, for requests that crossed to the api pod on the other node. |
What the screenshots show
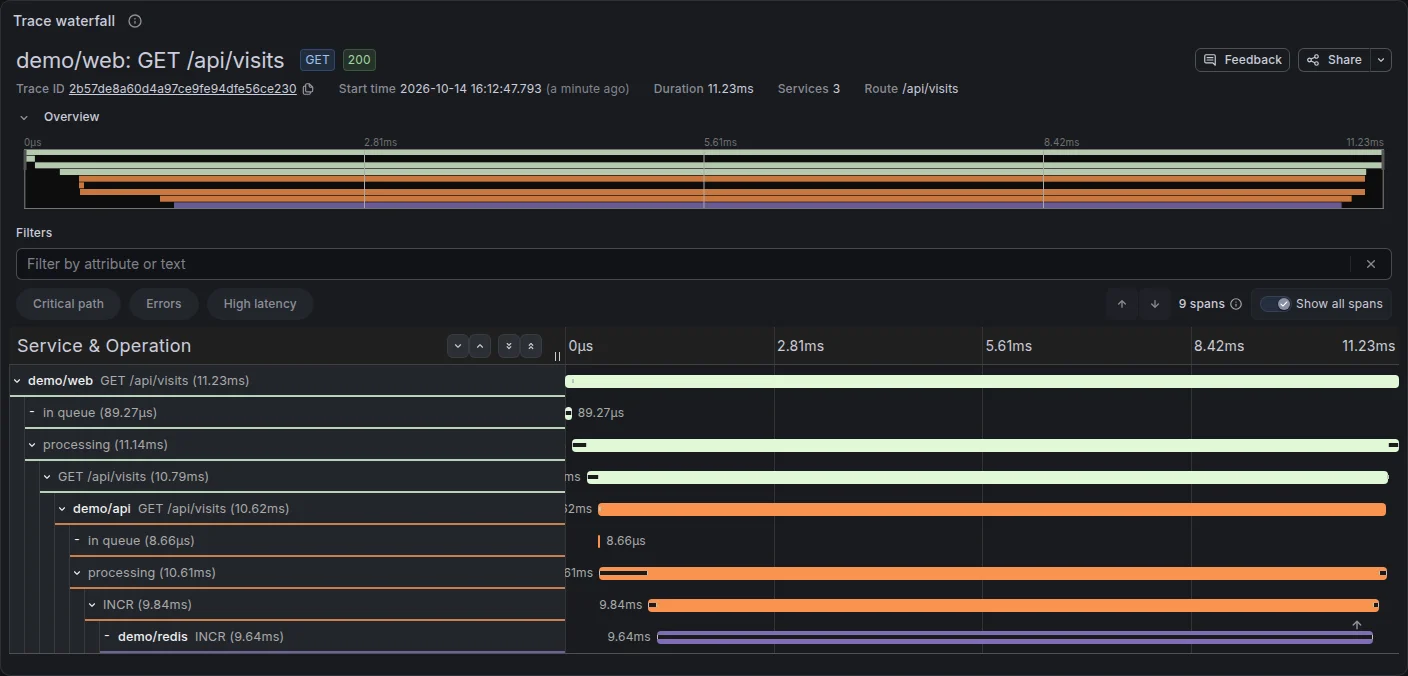
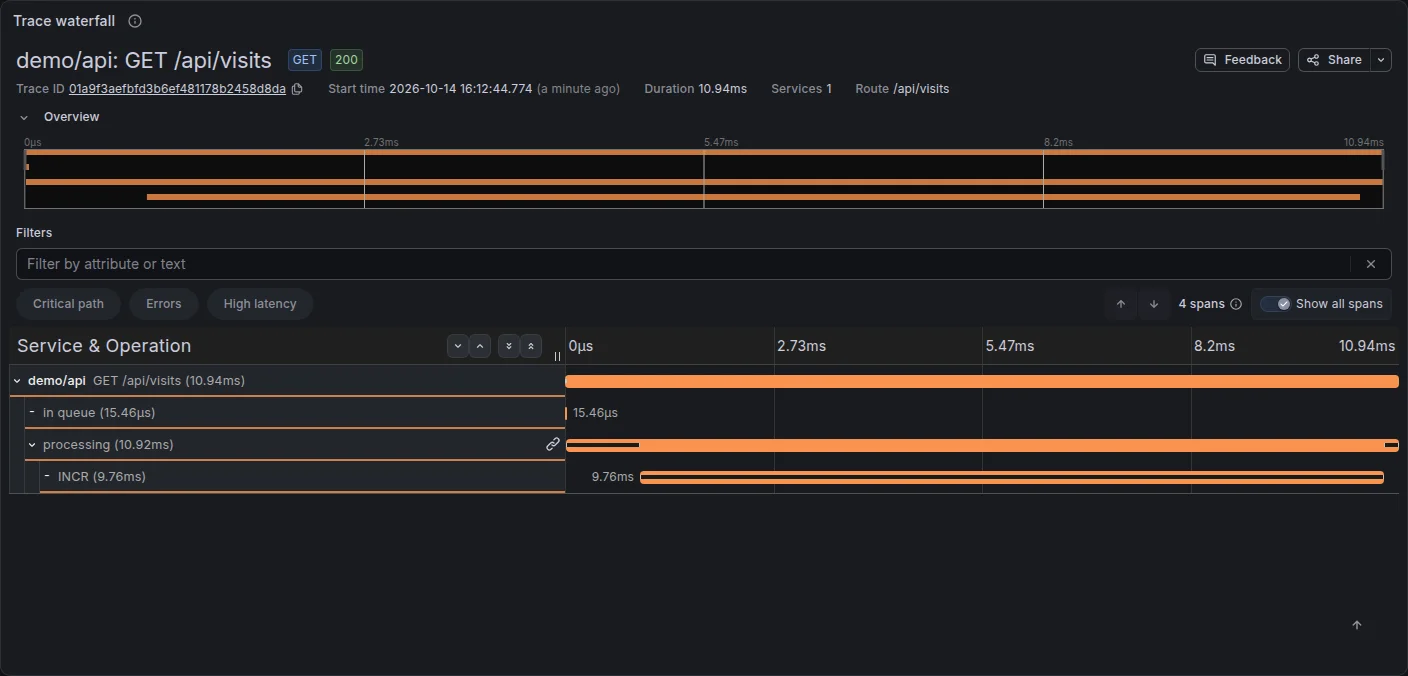
The two waterfalls are two kinds of trace from the same six visits.
The joined one, 2b57de8a…, starts at 16:12:47.793 and takes 11.23 ms: demo/web GET /api/visits (11.23 ms) → processing → a GET /api/visits client span (10.79 ms) → demo/api GET /api/visits (10.62 ms) → processing → INCR (9.84 ms) → demo/redis INCR (9.64 ms). Nine spans, three services: web’s call, the API’s handling and Redis’s own server-side span are one trace.
The split one, 01a9f3ae…, starts at 16:12:44.774 and takes 10.94 ms: its root is demo/api GET /api/visits (10.94 ms) → processing → INCR (9.76 ms). Four spans, one service. No web span above it, and no Redis span below it.
So the answer to the prediction is “sometimes”. In this cluster web, Redis and one API pod ran on the server node and the other API pod on the agent node. In an earlier run, before a rebuild placed the pods differently, I sent six visits three seconds apart and looked up every trace they produced, with the node of each span:
| Visit | Traces | Spans by service and node |
|---|---|---|
| 1 | 2 | web on agent-0 (4 spans) · separately: api on server-0 + redis on server-0 (5) |
| 2 | 1 | web + api, both on agent-0 (8) |
| 3 | 2 | web on agent-0 (4) · separately: api + redis, both on server-0 (5) |
| 4 | 1 | web + api, both on agent-0 (8) |
| 5 | 2 | web on agent-0 · separately: a trace rooted at the api on server-0 |
| 6 | 1 | web + api, both on agent-0 (8) |
Every time web and the api pod were on the same node, they shared a trace; every time the request crossed nodes, it split. The same rule holds one hop further: Redis’s span joins a trace only when the api pod that called it is on Redis’s node. The screenshots show both halves of that: the joined trace has the Redis span (everything on the server node); the split trace, from the API pod on the agent node, has none.
Why it happens
Nothing in the app propagates a traceparent header; OBI has to carry the context itself. Within one node, OBI sees both ends of the connection (nginx’s outgoing request and the API’s incoming one) through its probes in the same kernel, and can link them. Across nodes, the context has to travel inside the request. In this lab it didn’t arrive at the other node, so the API on the far side started a new trace. I didn’t pin down which part of the cross-node path loses it (OBI’s injection, Cilium’s VXLAN datapath or the nested k3d setup); the observable rule is reliable enough to design around.
The INCR durations are worth a second look too. In both screenshots INCR takes almost 10 ms, for a single in-memory increment; in the earlier run one took 417 µs. The { name = "INCR" && duration > 5ms } query in Part 5 finds the slow ones. I haven’t measured where that time goes; it’s a good next experiment (Go Further).
make verify-obi-traces uses the two TraceQL queries from the card, so it passes only when both kinds exist, and hands both trace IDs to the screenshots through the dashboard’s Trace variable.
Experiment 5: Catch a shell in a container
Open a shell in the web pod and see Falco’s syscall rules flag it within a second, with pod and container metadata, in the Falcosidekick UI.
Run a command through kubectl exec in the web pod.
make exp-falco-shellkubectl exec without -t has no terminal, so Falco’s stock rule doesn’t fire. What else in the event could identify this as suspicious?
| Signal | Where | Query | What you should see |
|---|---|---|---|
| events | Falcosidekick UI › Events | rule = "Shell in demo pod" | A WARNING with the command line, uid 101, pod web-… and namespace demo, resolved from k3s’s containerd. |
| logs | Grafana (mon) › Dashboards › Labs › eBPF lab › Falco alerts from the lab rules | {k8s_cluster_name="lab-ebpf", k8s_namespace_name="falco", k8s_container_name="falco"} |= "ebpf_lab" | The same alert as a log line, kept in mon with the rest of the lab’s signals. |
What the screenshots show
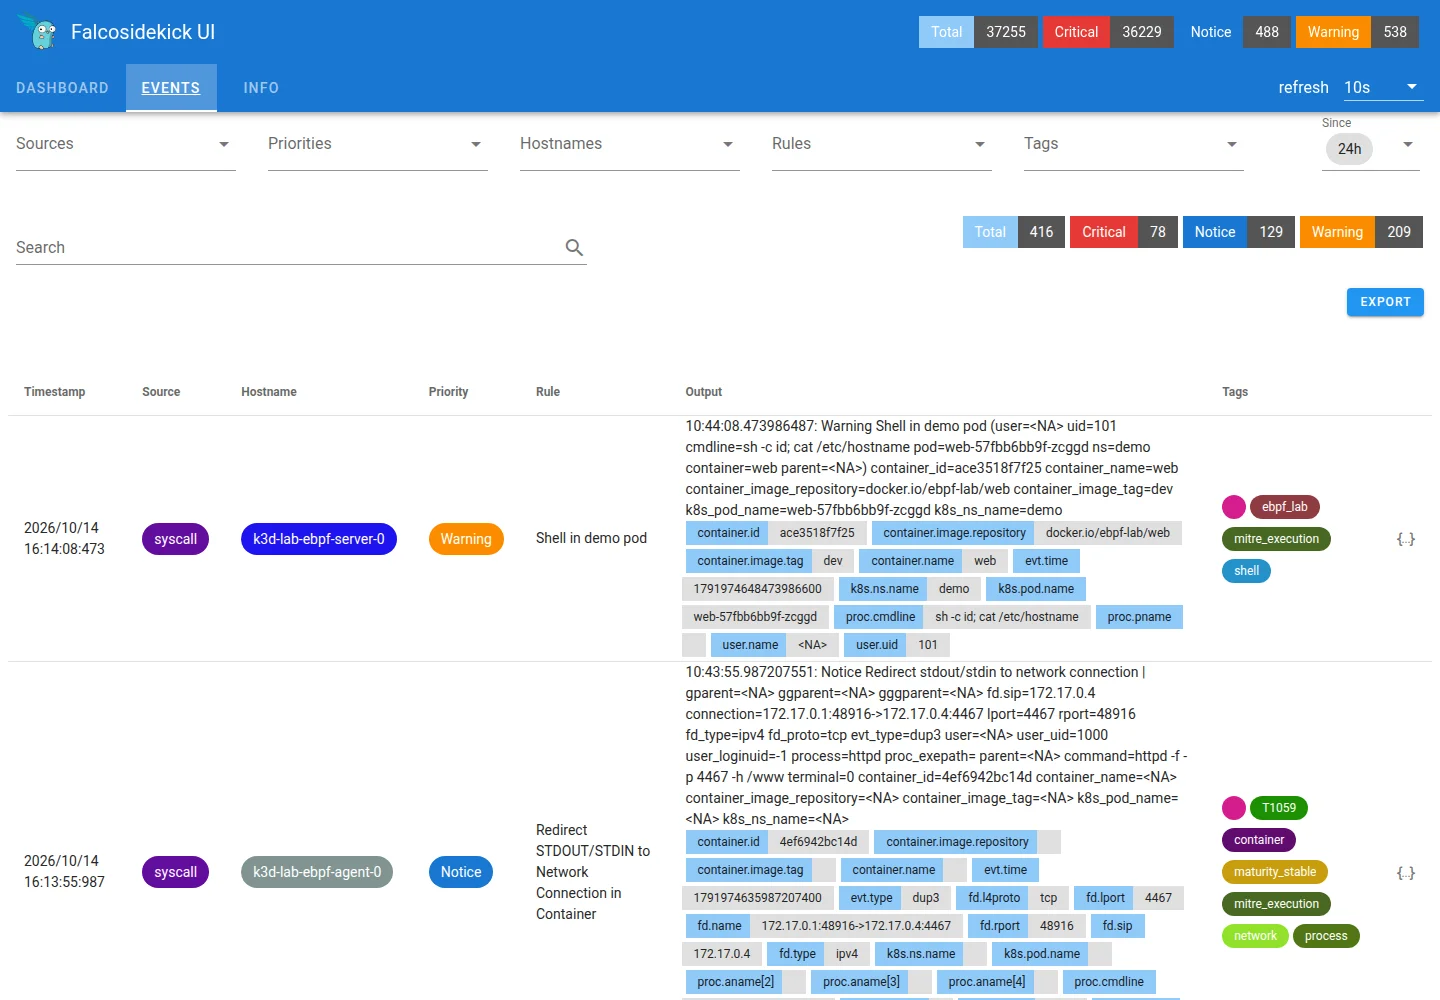
The Falcosidekick UI’s Events page has the alert at the top: Warning, rule Shell in demo pod, source syscall, hostname k3d-lab-ebpf-server-0, at 16:14:08.473. Its fields carry the command line sh -c id; cat /etc/hostname, user.uid 101, k8s.pod.name web-57fbb6bb9f-zcggd, k8s.ns.name demo, container.image.repository docker.io/ebpf-lab/web, and the tags ebpf_lab, mitre_execution and shell. Falco couldn’t fill in user.name (<NA>) or the parent process.
The counters in the header are the other lesson: 37,255 events in total, 36,229 of them Critical, almost all from Falco’s stock rules firing on processes elsewhere on the host. The next row down is one of them: a stock Redirect STDOUT/STDIN to Network Connection in Container notice for an httpd process with no pod at all.
To the prediction: the stock rule Terminal shell in container needs a TTY, and kubectl exec without -t has none. The lab’s rule matches on what’s left: a shell process (proc.name in (sh, bash, ash, dash)) spawned in a container in namespace demo.
Why it happens
kubectl exec asks the kubelet, which asks containerd, to start sh inside the web container. That’s an execve syscall. Falco’s modern eBPF probe sees it in the kernel, the container plugin looks the container up in k3s’s containerd to add the pod, namespace and image, and the rule in helm/falco-values.yaml matches. The alert goes to stdout (and so to Loki) and to Falcosidekick, which stores it for the UI.
Experiment 6: Kill a download before it starts
Apply a Tetragon policy that SIGKILLs any process in a demo pod that calls execve() for wget, curl or nc, run wget, and compare what Tetragon and Falco each record.
Apply the Tetragon policy, then run wget from the web pod.
make exp-tetragon-enforceIn experiment 2, Falco raised a CRITICAL Network tool alert for nc. Will it raise one for wget now that Tetragon guards execve()?
| Signal | Where | Query | What you should see |
|---|---|---|---|
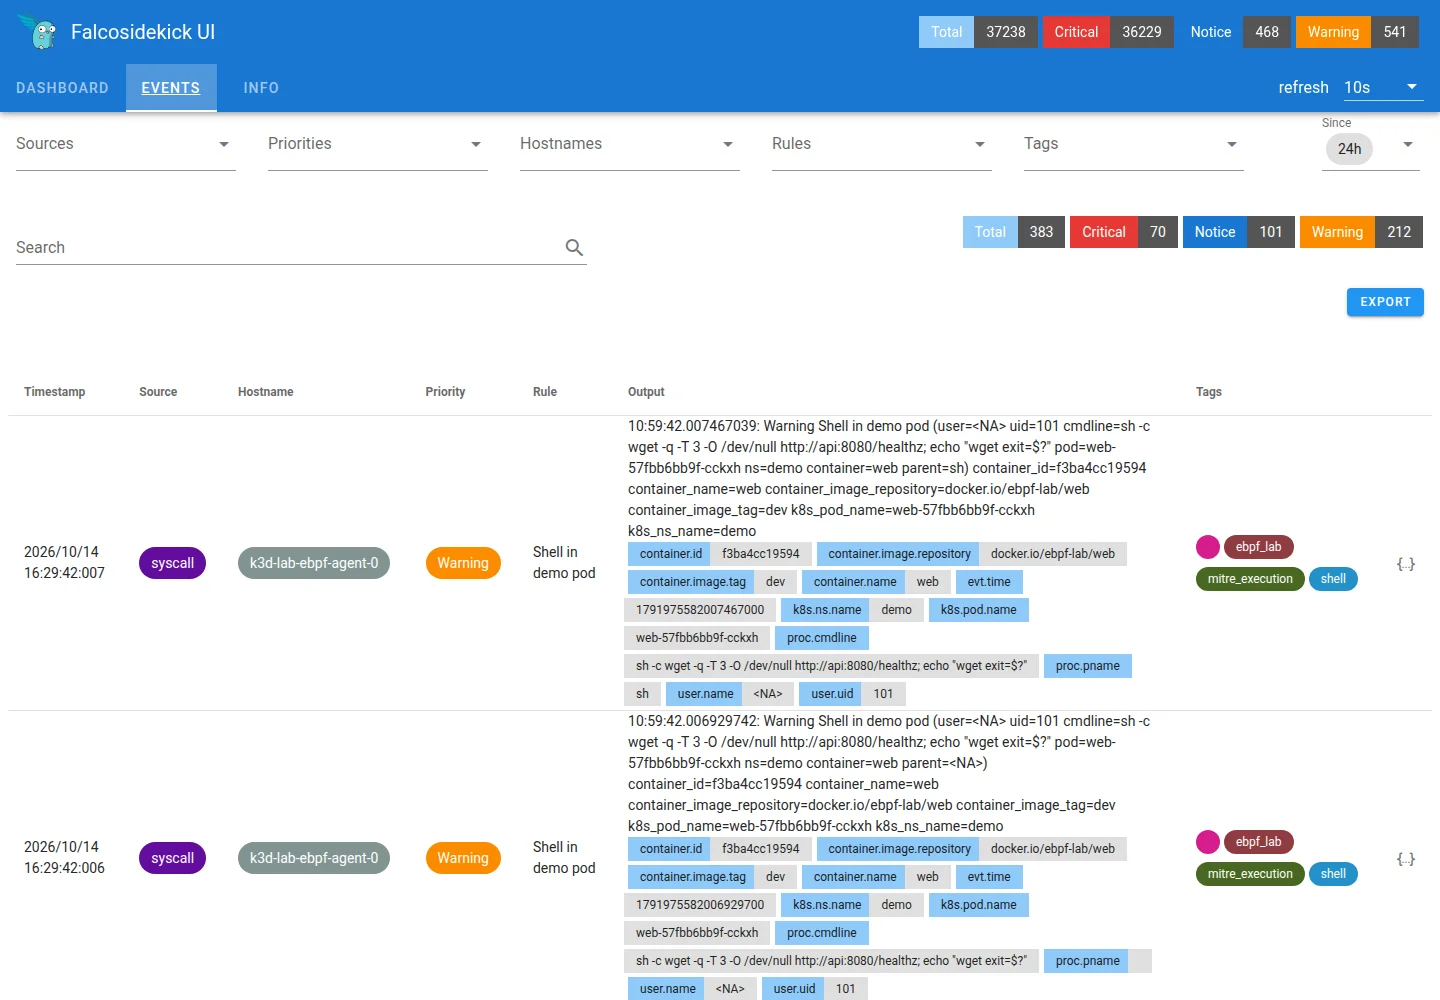
| events | Falcosidekick UI › Events | rule = "Shell in demo pod" or rule = "Network tool in demo pod" | Only Shell in demo pod for the sh -c wget command. No Network tool alert for wget: it never started. The CRITICAL one in the list is experiment 2’s nc. |
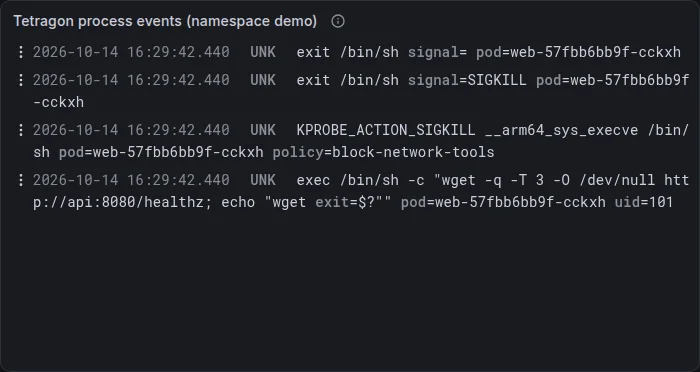
| logs | Grafana (mon) › Dashboards › Labs › eBPF lab › Tetragon process events (or make tetragon-events) | {k8s_cluster_name="lab-ebpf", k8s_container_name="export-stdout"} |= "SIGKILL" | The shell’s exec, then KPROBE_ACTION_SIGKILL on __arm64_sys_execve for /bin/sh with policy block-network-tools, then that sh exiting with SIGKILL; the command prints wget exit=137. |
What the screenshots show
The terminal output is short:
1
2
3
4
5
$ make exp-tetragon-enforce
kubectl --context k3d-lab-ebpf apply -f k8s/policies/tetragon-block-net-tools.yaml
tracingpolicynamespaced.cilium.io/block-network-tools created
wget exit=137
Killed
The Tetragon panel has four events at 16:29:42.440 (the panel lists them newest first; here they are in the order they happened):
exec /bin/sh -c "wget -q -T 3 -O /dev/null http://api:8080/healthz; echo "wget exit=$?"" pod=web-57fbb6bb9f-cckxh uid=101KPROBE_ACTION_SIGKILL __arm64_sys_execve /bin/sh pod=web-57fbb6bb9f-cckxh policy=block-network-toolsexit /bin/sh signal=SIGKILLexit /bin/sh signal=(no signal)
Falco’s screenshot is the answer to the prediction. It has two Warning: Shell in demo pod events for the sh -c wget … command, at 16:29:42.006 and .007, one with parent=sh and one with parent=<NA>. There is no Network tool in demo pod alert for wget. The lab’s Network tool rule fired only for the nc in Experiment 2 (16:09:54, visible in the dashboard’s Falco panel in Part 5), before any Tetragon policy existed.
The first attempt at this capture used a 10-second wait, and the Tetragon panel showed only the kill and the child’s SIGKILL exit; the exec and the parent’s exit reached Loki a few seconds later. The experiment now waits 25 seconds.
Why it happens
k8s/policies/tetragon-block-net-tools.yaml hooks the execve syscall itself:
1
2
3
4
5
6
7
8
9
10
11
12
13
14
spec:
  kprobes:
    - call: sys_execve
      syscall: true
      args:
        - index: 0
          type: string          # the path exactly as passed to execve(), e.g. /usr/bin/wget
      selectors:
        - matchArgs:
            - index: 0
              operator: Postfix
              values: ["/wget", "/curl", "/nc"]
          matchActions:
            - action: Sigkill
Read the events in order. The shell started (event 1). To run wget, it forked a child, still /bin/sh, and the child called execve("/usr/bin/wget", …). Tetragon’s kprobe matched the path argument and sent SIGKILL to the caller (event 2), inside the syscall, before the kernel replaced the child’s program. The child died as /bin/sh with SIGKILL (event 3); the parent shell carried on, printed wget exit=137 (128 + signal 9), and exited normally (event 4).
So wget never ran. Falco’s Network tool rule needs a process named wget to be spawned, and none was. It reported the shell twice; the one with parent=sh lines up with the forked child in Tetragon’s events, and its process name was still sh when it was killed. That’s the real difference between the two tools here: Tetragon acted inside the syscall and kept the evidence of the attempt; Falco reports what it sees run, and the download never ran.
The first version of this policy hooked the LSM function security_bprm_check and matched /wget there. It loaded fine and never fired: that hook sees the resolved file, and in busybox images /usr/bin/wget is a symlink to /bin/busybox. Matching the syscall’s argument sees the path as the caller typed it. That also means the policy is easy to dodge: busybox wget … passes /bin/busybox and isn’t killed.
This experiment’s verify used to check for Falco’s Network tool alert and passed anyway, because it found Experiment 2’s nc alert. It now checks for the shell alert with wget in its command line.
Experiment 7: Delete the cluster and keep the data
Delete and recreate the whole cluster and see Redis come back with the same counter, because its PVC re-binds to a static local PV over the same host folder.
Note the visit count, rebuild the cluster from scratch, then count a visit again.
make exp-rebuild-persistsk3d deletes both node containers. Where does the counter live, and which object makes the new Redis pod find it?
| Signal | Where | Query | What you should see |
|---|---|---|---|
| events | The app page | GET /api/visits | The counter continues from its value before the rebuild instead of starting at 1. |
What the screenshots show
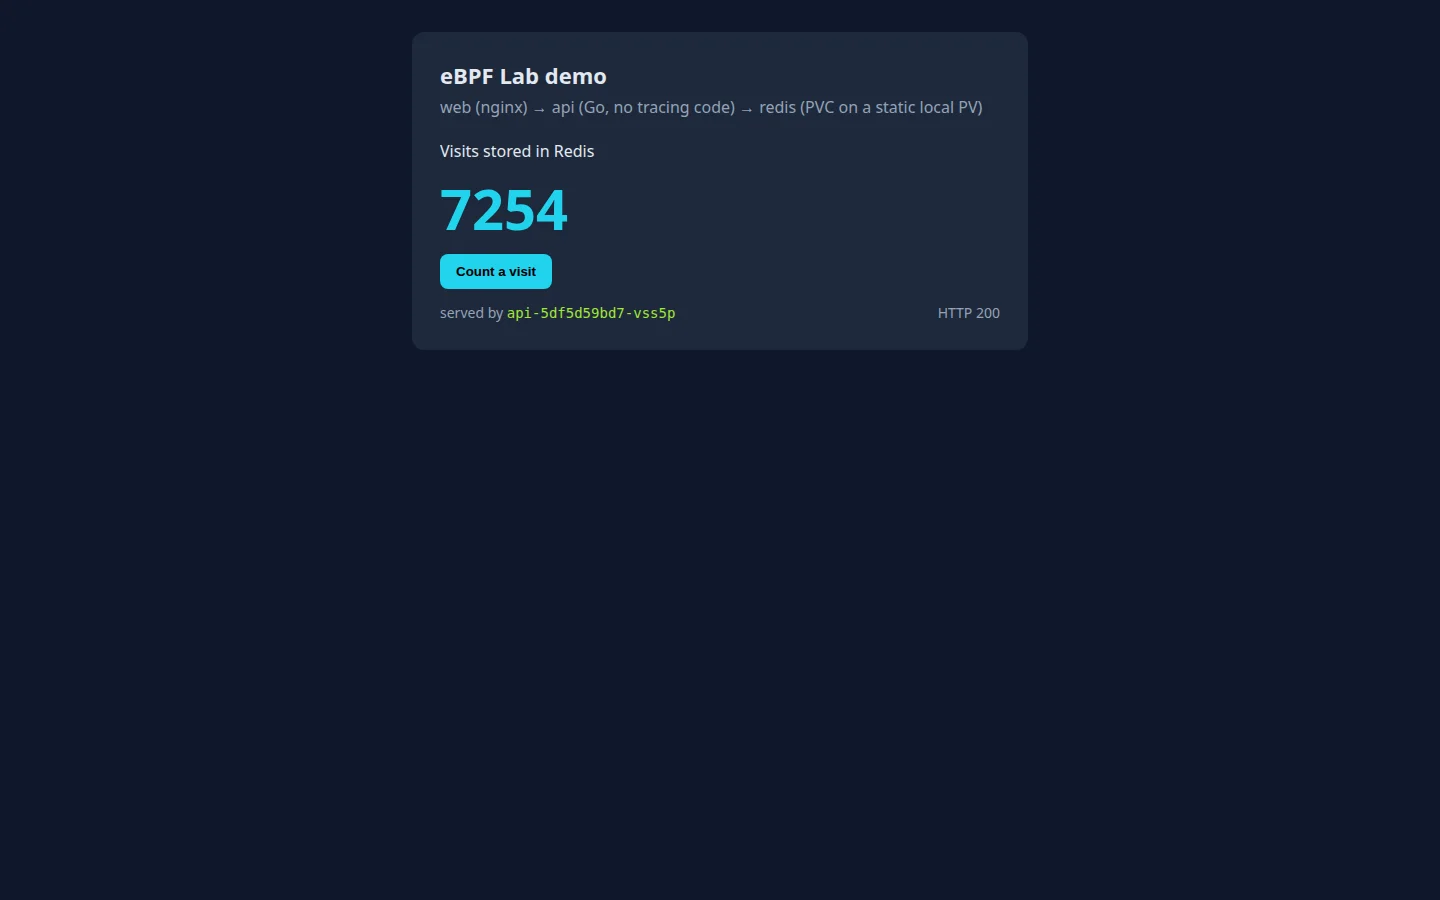
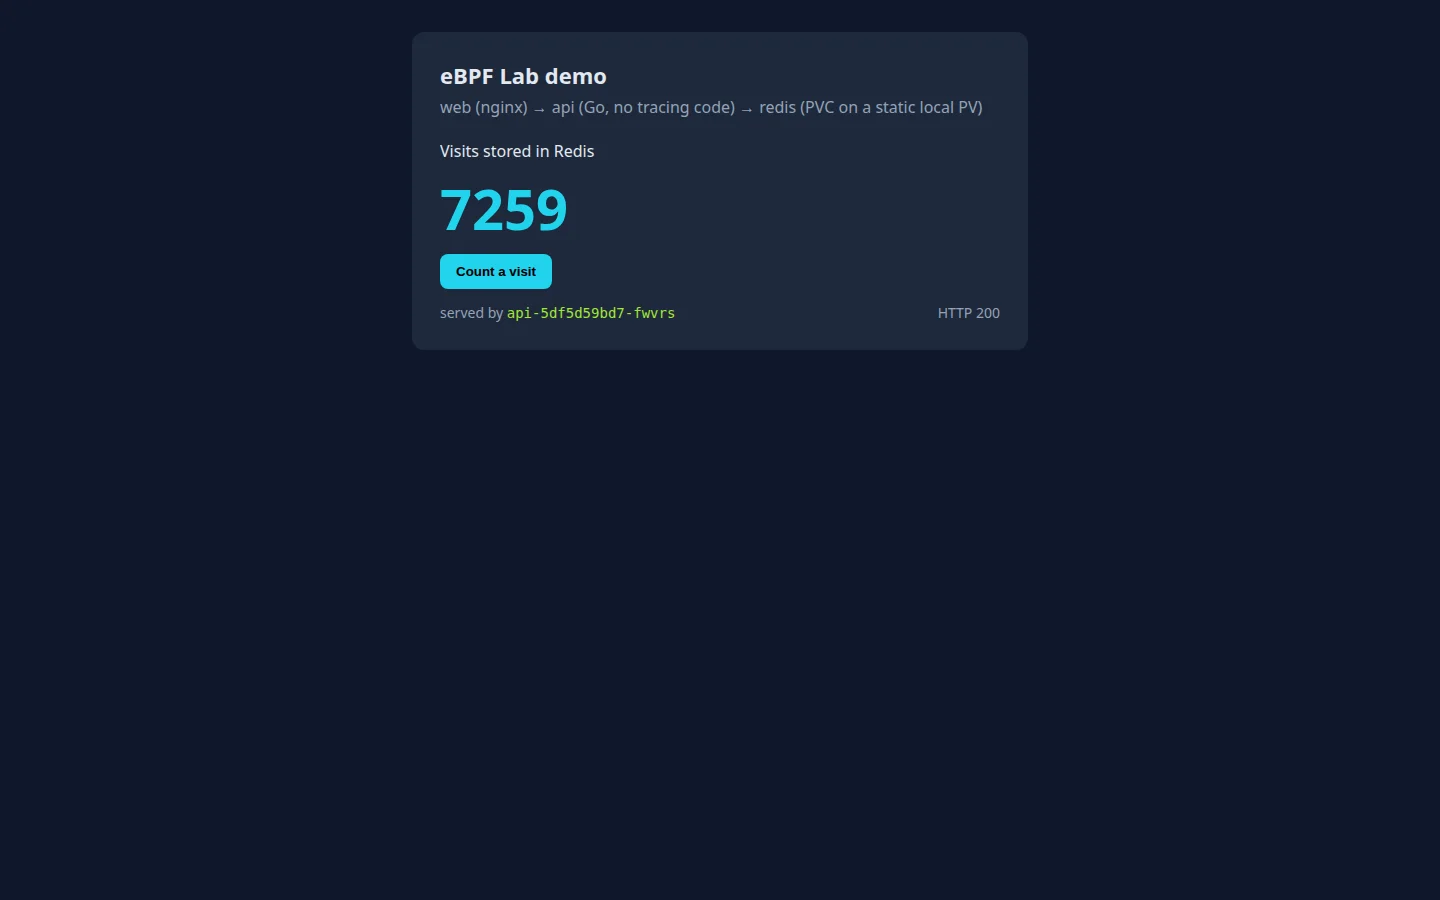
Before: the page shows 7254 visits, served by api-5df5d59bd7-vss5p. After the rebuild: 7259, served by api-5df5d59bd7-fwvrs, a pod name from the new cluster. The count went on instead of starting at 1.
The five visits in between are all accounted for: exp-rebuild-persists counts one before the rebuild and one after, the verify counts one, and the two page loads (the experiment’s browser step and the after-shot) count one each, because the page itself calls /api/visits. The rebuild, make down and make up together, took about 12 minutes.
Why it happens
make down unregistered the lab and deleted both node containers; nothing of the cluster was left. The Redis data wasn’t in the cluster: it was in /srv/homelab/labs/ebpf-lab/redis on the host, as an append-only file. make up recreated the PV ebpf-lab-redis over the same folder, with claimRef reserving it for demo/redis-data and node affinity pinning it to k3d-lab-ebpf-server-0, which exists again under the same name. The new claim bound to it, Redis replayed its AOF, and the counter continued (Storage that outlives the cluster). No pod ever mounted a host path; only the server node container did.
Check Your Understanding
In Experiment 2, why does Hubble show several drops for one nc attempt?
The policy drops the TCP SYN, so the client never gets an answer and the kernel retransmits the SYN until nc’s 3-second timeout. Each retransmission is dropped and recorded again.
You scale the API to one replica on the agent node, next to web. What will Experiment 4's traces look like, and what stays split?
web and the API would always share a trace (same node). Redis is on the server node, so its server-side span would still be in no web trace; you’d see the API’s INCR client span but not demo/redis INCR.
Falco reported Experiment 2's nc as Critical but not Experiment 6's wget. Was Falco's rule wrong?
No. The rule matches a completed exec of a network tool. nc ran (no Tetragon policy existed yet), so it matched. wget was killed inside execve() before it ran, so there was no completed exec to match.
How would you get past the Tetragon policy from inside the web pod, and how would you close that gap?
Run busybox wget … (or copy the binary to a new name): the path passed to execve no longer ends in /wget. To close it, match more than the name, for example the file’s inode or hash, or restrict what the container can execute at all.
After the rebuild, the counter went up by 5, but you ran one command. Where do the other visits come from?
From the experiment’s own steps: one visit before the rebuild, one after, one in the verify, and one per page load, because the page calls /api/visits when it loads.