eBPF Lab 7
Swap a k3d cluster's networking for Cilium and watch every flow in Hubble, get RED metrics and traces from an app with no instrumentation code, and catch (then kill) a shell's download in a container with Falco and Tetragon, all with eBPF on one DGX Spark.
Parts
What you build, what you need, and how requests and signals travel through it.
The application and its instrumentation, file by file.
The cluster, the app manifests and the observability stack that receives the signals.
Bring everything up, check the rollout and smoke-test the endpoints.
A tour of the dashboard, the query behind each panel, and how long each signal takes to arrive.
Perform an action, predict the signal, then check the dashboard and explain what changed.
What the experiments proved, where this setup stops, and what production would change.
Experiments
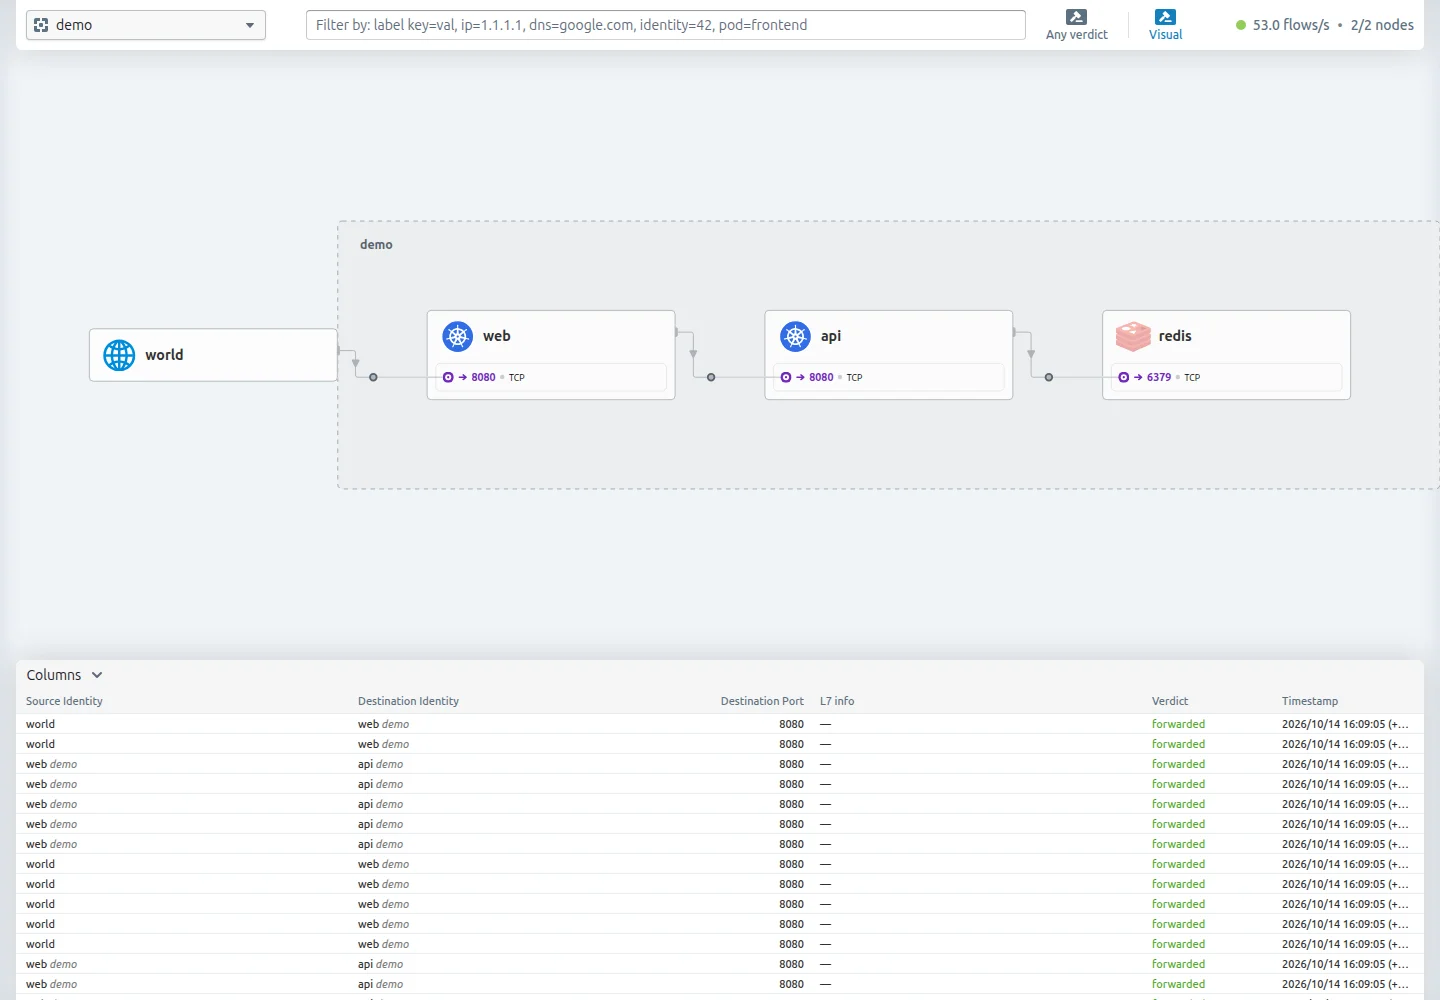
Send traffic through web, api and redis and see each hop in Hubble, with Cilium's eBPF doing the service load balancing that kube-proxy used to do.
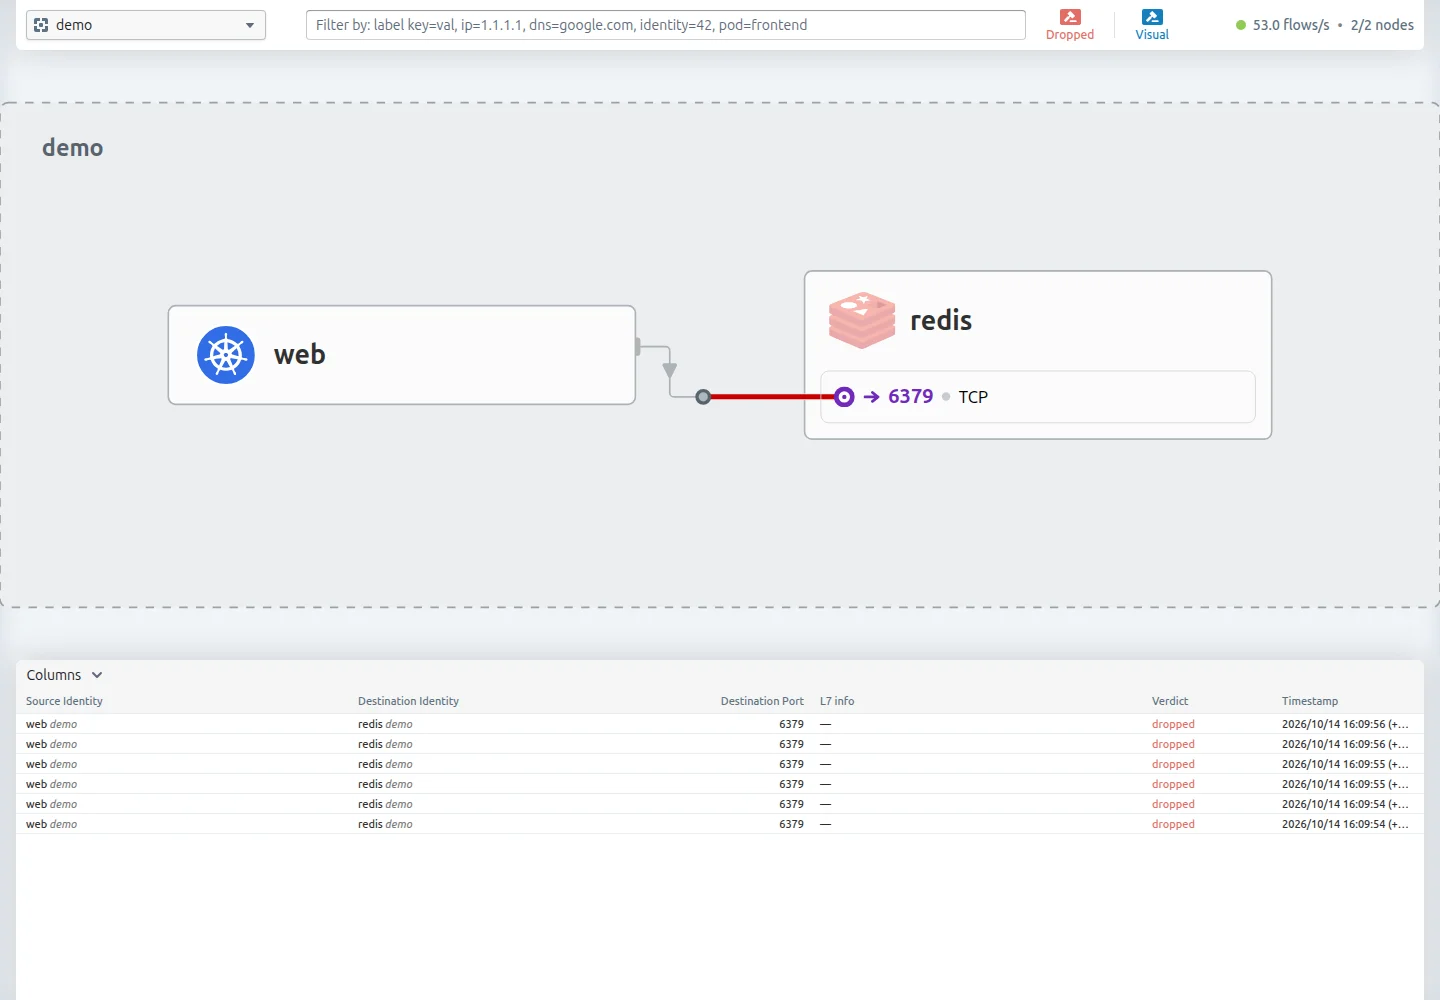
Allow only api pods to talk to redis and watch Cilium drop web's direct connection in eBPF, while the app keeps working.
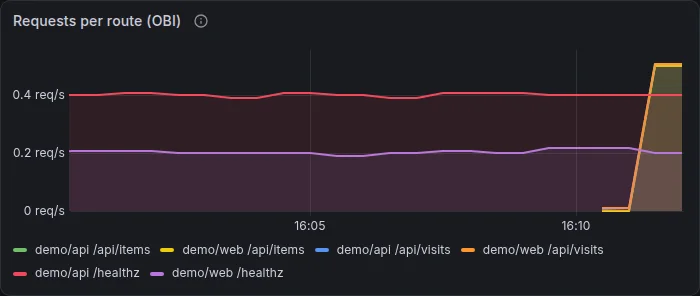
Let OpenTelemetry eBPF Instrumentation watch the Go API and Redis from the kernel and turn their traffic into request rate, errors and duration per route.
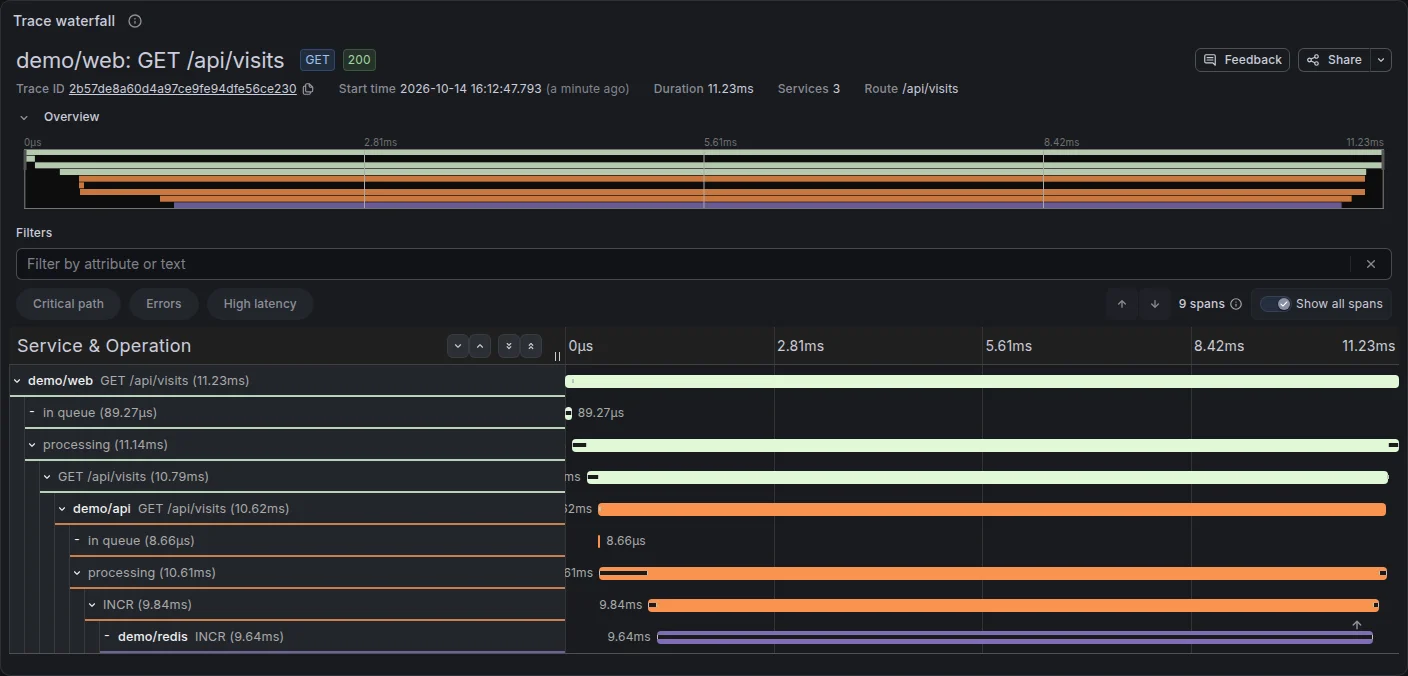
Follow requests through nginx, the Go API and Redis as traces that OBI builds from the kernel, and find out when its trace context joins them into one trace and when it doesn't.
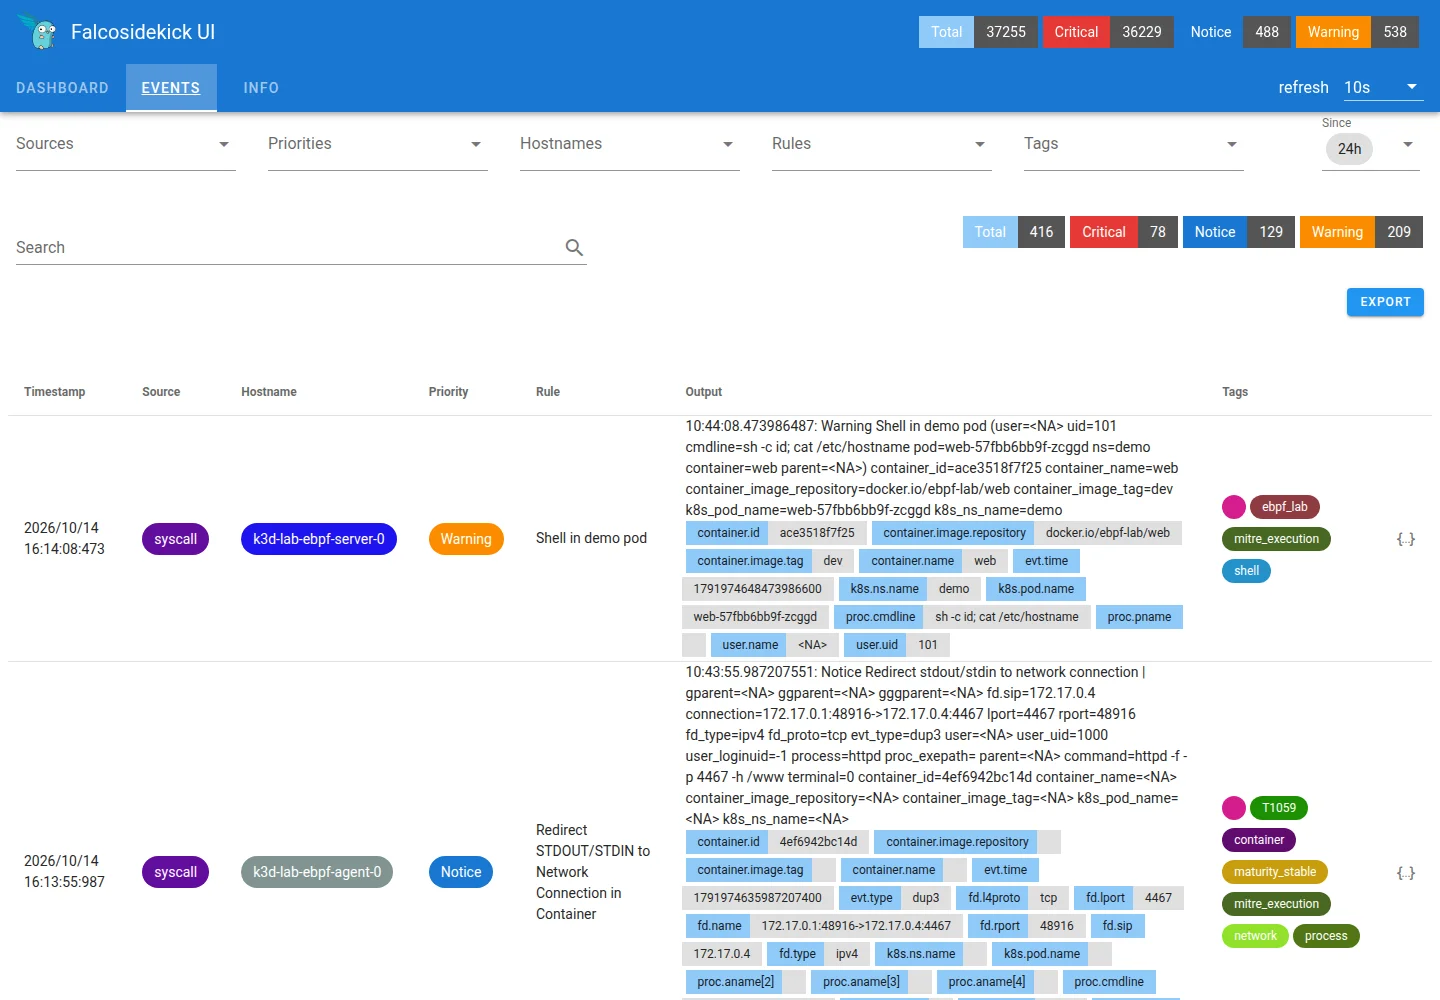
Open a shell in the web pod and see Falco's syscall rules flag it within a second, with pod and container metadata, in the Falcosidekick UI.
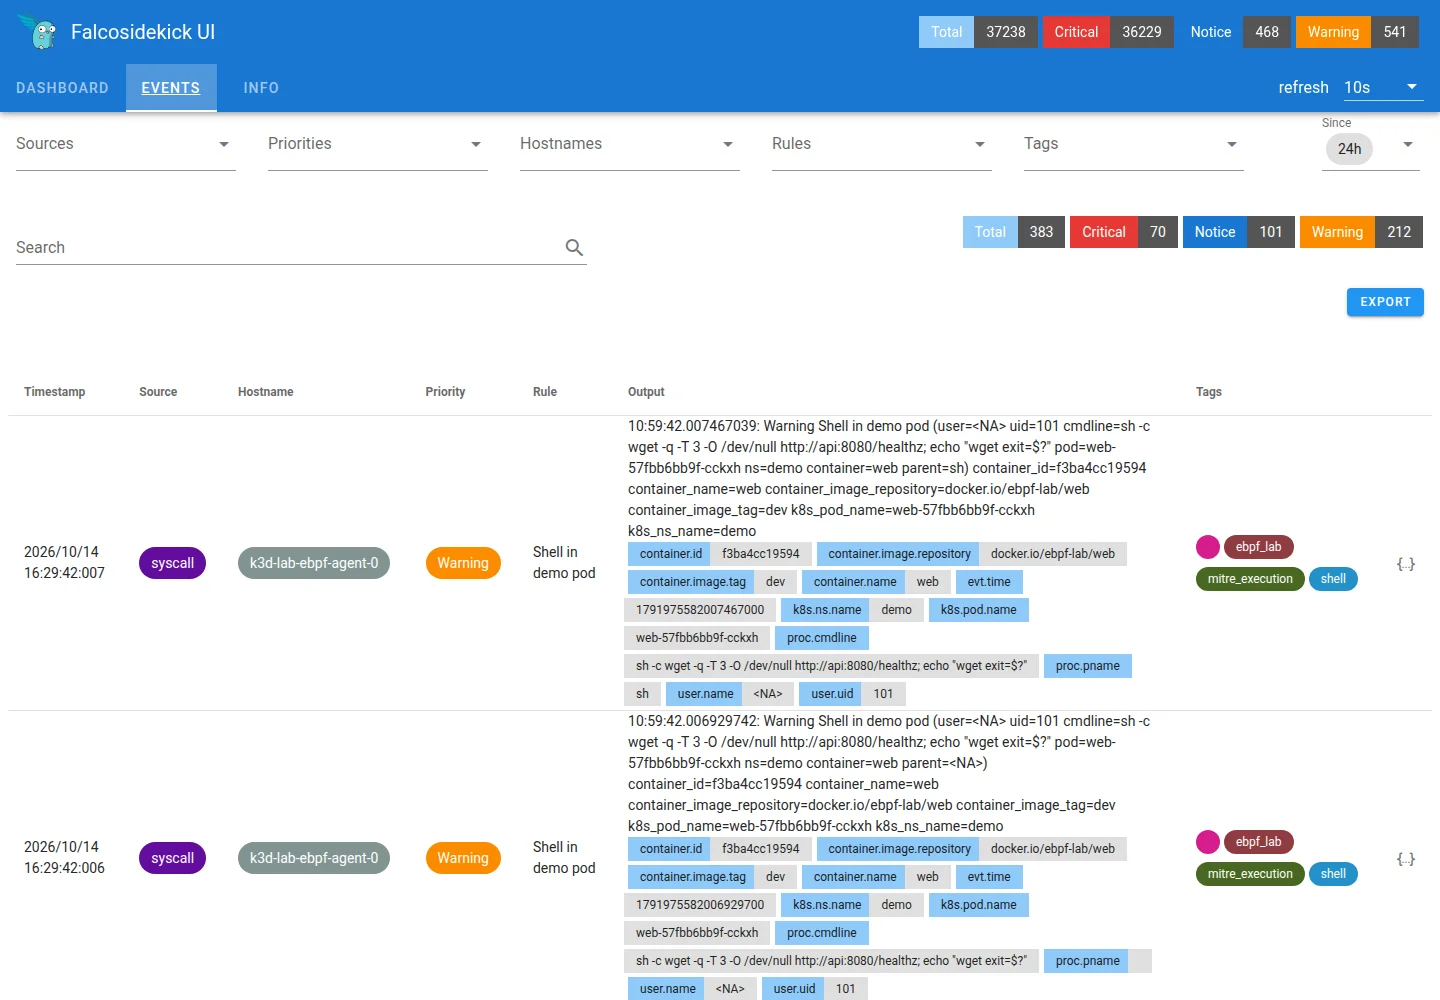
Apply a Tetragon policy that SIGKILLs any process in a demo pod that calls execve() for wget, curl or nc, run wget, and compare what Tetragon and Falco each record.
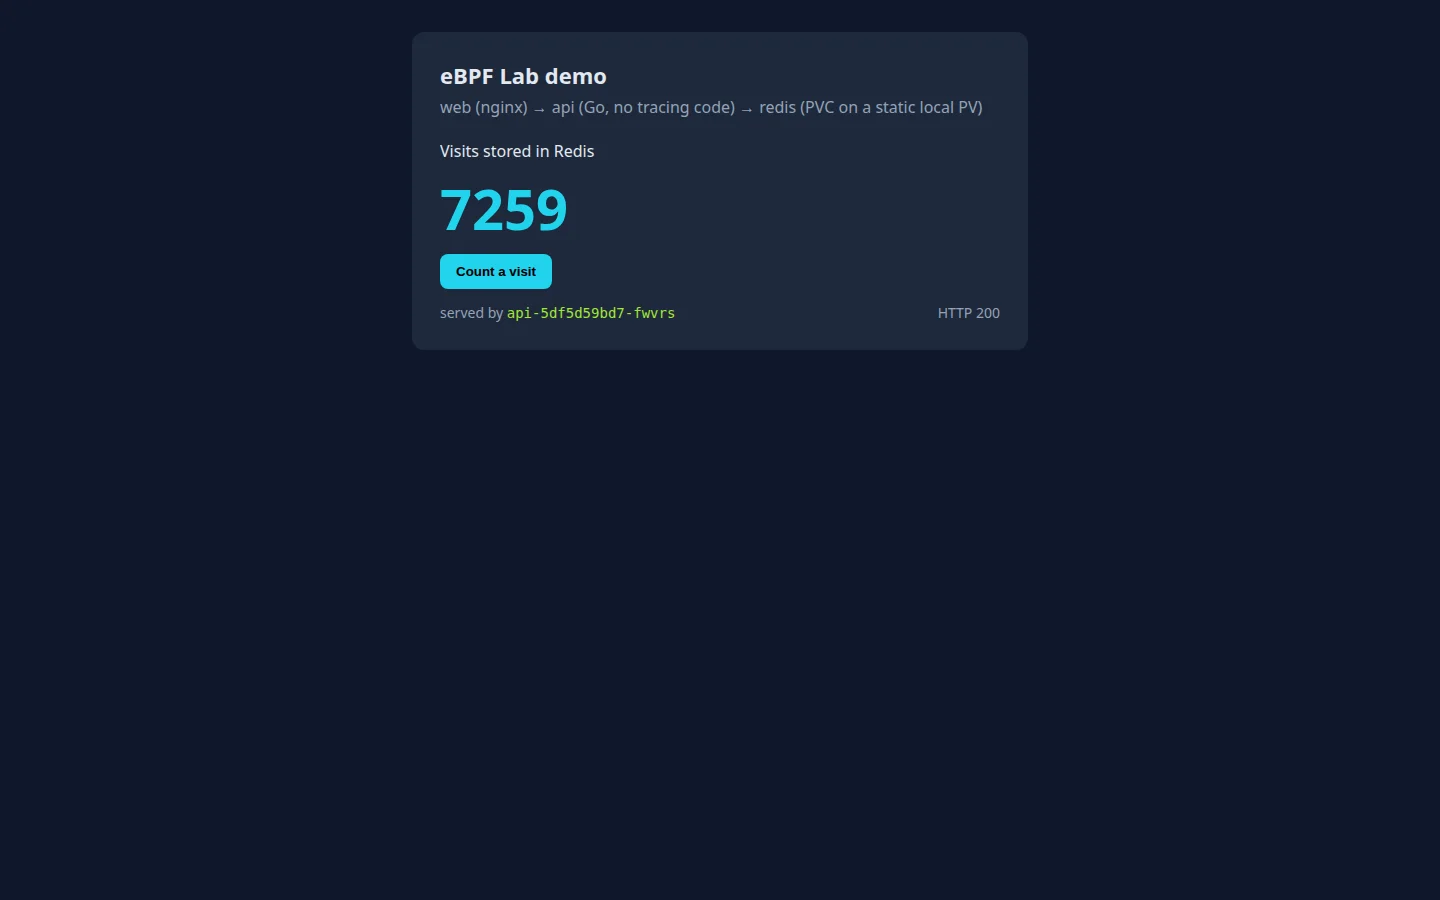
Delete and recreate the whole cluster and see Redis come back with the same counter, because its PVC re-binds to a static local PV over the same host folder.