eBPF Lab: Monitor
A tour of the dashboard, the query behind each panel, and how long each signal takes to arrive (eBPF Lab lab).
This lab has three places to look: the eBPF lab dashboard in mon’s Grafana, the Hubble UI and the Falcosidekick UI. This part tours the dashboard panel by panel with the query behind each one, lists the queries worth knowing for each backend, and works out how long each signal takes to show up. Those delays set the waits in every experiment.
Open the Dashboard
In mon’s Grafana (https://grafana.mon.home.cloudutsuk.com, Keycloak sign-in), go to Dashboards › Labs › eBPF lab: OBI, Tetragon and Falco (uid ebpf-lab). It opens on the last 30 minutes and refreshes every 30 seconds.
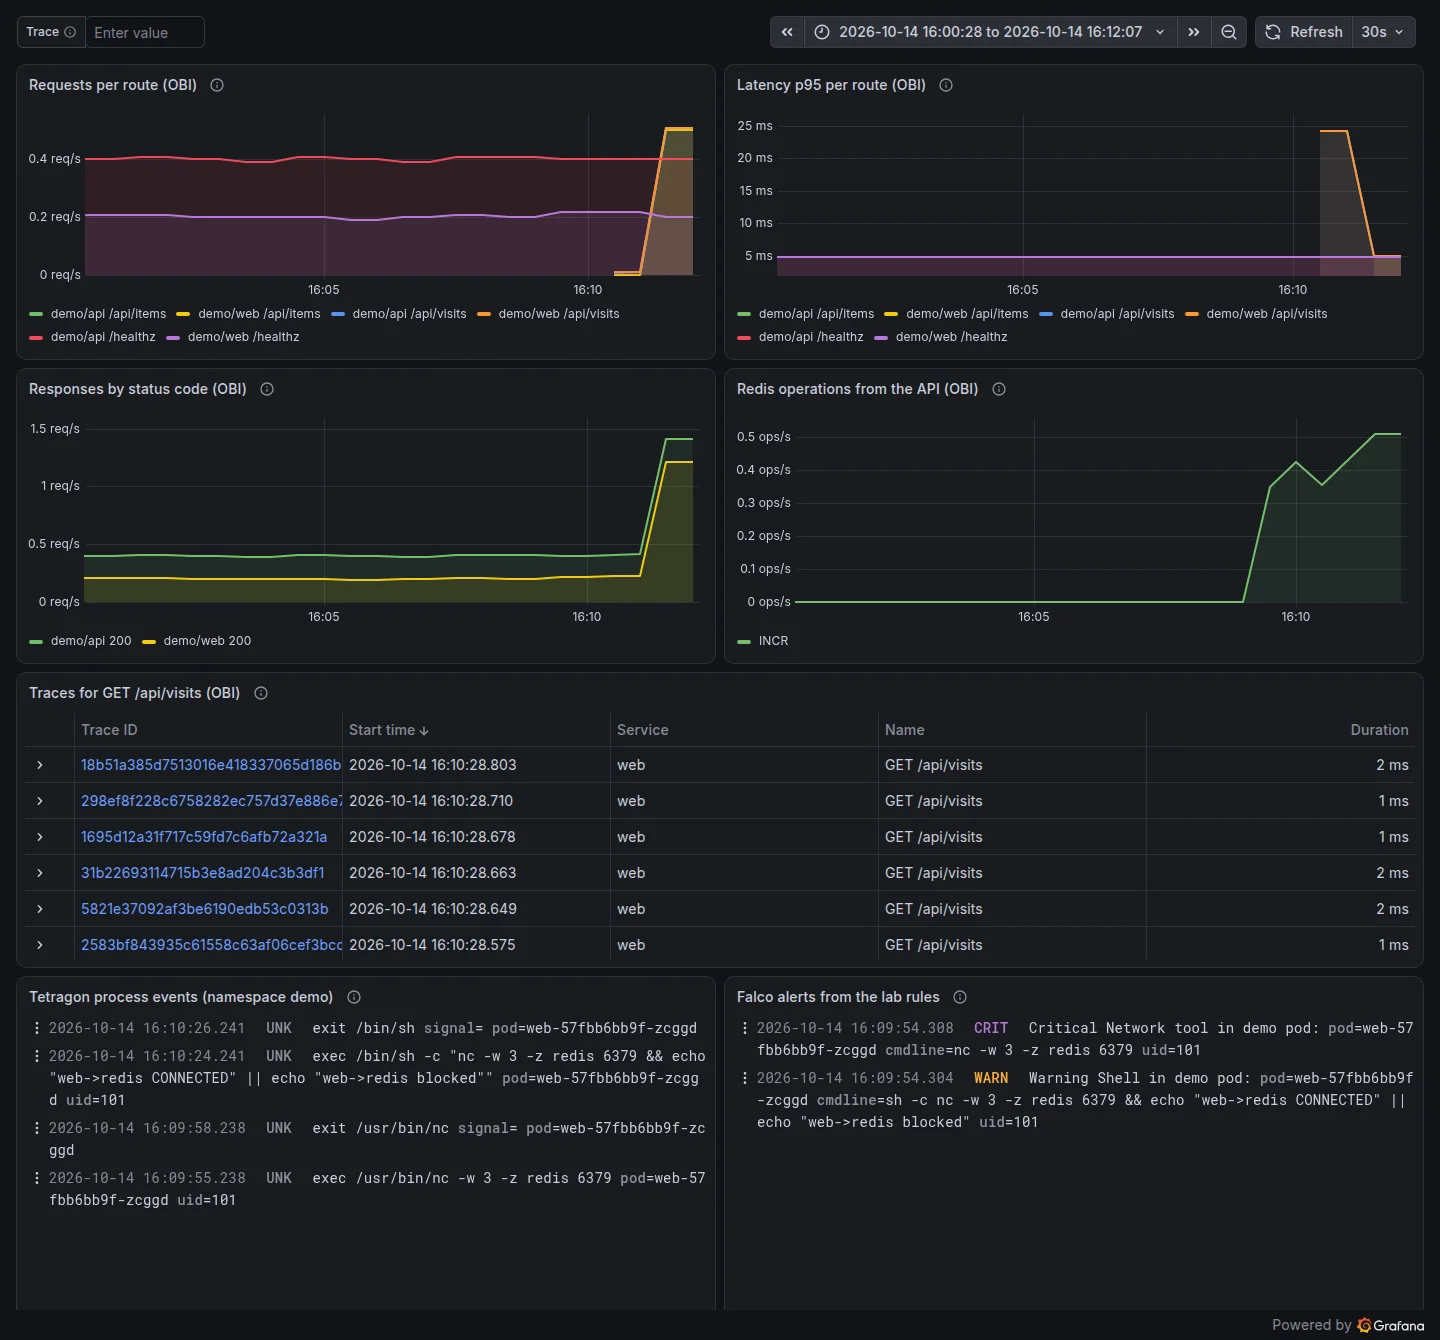 The dashboard as captured in Experiment 3, as its burst of
make traffic arrives; the Tetragon and Falco panels still show Experiment 2’s nc.
The one variable, Trace, at the top left, is a text box: paste a trace ID from the trace table into it and the Trace waterfall panel at the bottom draws that trace. That’s how you open a trace on this dashboard as a Viewer, because Explore needs the Editor role in mon’s Grafana.
Two things are deliberately not on the dashboard:
- Hubble flows. They never leave the cluster; open http://127.0.0.1:8092 and pick namespace
demo. - Falco’s stock rules. They fire for processes anywhere on the host. The Falcosidekick UI (http://127.0.0.1:8093,
admin/admin) shows everything; filter its Tags onebpf_lab.
Panel by Panel
Every query filters on cluster="lab-ebpf" (metrics), k8s_cluster_name="lab-ebpf" (logs) or resource.k8s.cluster.name = "lab-ebpf" (traces), because mon holds every homelab cluster’s data.
| Panel | Query | What it answers | Normal here |
|---|---|---|---|
| Requests per route (OBI) | sum by (job, http_route) (rate(http_server_request_duration_seconds_count{cluster="lab-ebpf", job=~"demo/.*"}[3m])) | How many requests each service handles, per route | demo/api /healthz about 0.4 req/s, demo/web /healthz about 0.2 req/s from readiness probes alone; /api/visits and /api/items rise to about 0.5 req/s each during make traffic |
| Latency p95 per route (OBI) | histogram_quantile(0.95, sum by (le, job, http_route) (rate(http_server_request_duration_seconds_bucket{…}[5m]))) | How slow the slowest 5% are | Probes under 5 ms; demo/web /api/visits up to about 24 ms during a burst |
| Responses by status code (OBI) | sum by (job, http_response_status_code) (rate(…_count{…}[3m])) | The Errors in RED | Only 200 lines in this lab |
| Redis operations from the API (OBI) | sum by (db_operation_name) (rate(db_client_operation_duration_seconds_count{…}[3m])) | Which Redis commands the API sends, how often | INCR, flat at zero between bursts |
| Traces for GET /api/visits (OBI) | { resource.k8s.cluster.name = "lab-ebpf" && resource.k8s.namespace.name = "demo" && name = "GET /api/visits" } | Recent visit traces, with their root service | Rows for both web and api; Experiment 4 explains why there are two kinds |
| Trace waterfall | $trace | The spans of one trace | Empty until you set Trace |
| Tetragon process events (namespace demo) | {k8s_cluster_name="lab-ebpf", k8s_container_name="export-stdout"} \| json \| line_format … | Which processes ran in demo pods, and what Tetragon did | exec and exit lines for the experiments’ commands; KPROBE_ACTION_SIGKILL after Experiment 6 |
| Falco alerts from the lab rules | {k8s_cluster_name="lab-ebpf", k8s_namespace_name="falco", k8s_container_name="falco"} \|= "ebpf_lab" \| json \| line_format … | Which of the lab’s two rules fired, for which command | Empty until Experiment 2 or 5 |
Three details behind these numbers:
- The steady
/healthzlines are probes. Each API pod’s readiness probe runs every 5 seconds, 0.2 req/s per pod and 0.4 for two; web has one pod. OBI counts them like any request; they’re a useful heartbeat that shows OBI is alive. demo/webanddemo/apiboth report/api/visits. OBI measures nginx’s server side and the Go API’s server side separately; web’s latency includes the API’s.- The Tetragon panel’s query drops noise after formatting. It ends with
!~ "^(exec|exit) /proc/self/fd/" !~ "redis-cli": the first hides the container runtime’s own exec (/proc/self/fd/6 init) that precedes everykubectl execand exec probe, the second hides Redis’s readiness probe, which would otherwise add a line every 5 seconds.
Explore Queries
Paste these into Explore if your Grafana role has it (Editor), or into a panel of your own. The lab’s verify-* targets send the same kind of query with curl to /api/datasources/proxy/uid/<uid>/….
PromQL (Mimir)
# Everything OBI produced for the lab, by metric name
count by (__name__) ({cluster="lab-ebpf", job=~"demo/.*"})

# Redis command latency, p95, from the API's side
histogram_quantile(0.95, sum by (le) (rate(db_client_operation_duration_seconds_bucket{cluster="lab-ebpf"}[5m])))

# Calls the web tier makes to the API, as a client
sum by (http_route) (rate(http_client_request_duration_seconds_count{cluster="lab-ebpf", job="demo/web"}[3m]))
The first one returns, among others, http_server_request_duration_seconds_*, http_client_request_duration_seconds_*, db_client_operation_duration_seconds_*, db_server_operation_duration_seconds_* (Redis’s own side) and the request and response body size histograms.
LogQL (Loki)
# Tetragon kills, from any policy
{k8s_cluster_name="lab-ebpf", k8s_container_name="export-stdout"} |= "SIGKILL"

# Falco's lab rules, as raw JSON
{k8s_cluster_name="lab-ebpf", k8s_namespace_name="falco", k8s_container_name="falco"} |= "ebpf_lab"

# nginx's access log, as the agent collector tailed it (nginx doesn't send OTLP)
{k8s_cluster_name="lab-ebpf", k8s_namespace_name="demo", k8s_container_name="web"} |= "/api/visits"
TraceQL (Tempo)
1
2
3
4
5
6
7
8
# Traces where web's span has an api span under it (one request, one trace)
{ resource.k8s.cluster.name = "lab-ebpf" && resource.service.name = "web" } >> { resource.service.name = "api" }

# Traces that start at the api (the request arrived without trace context)
{ resource.k8s.cluster.name = "lab-ebpf" && trace:rootService = "api" && trace:rootName = "GET /api/visits" }

# Slow Redis calls
{ resource.k8s.cluster.name = "lab-ebpf" && name = "INCR" && duration > 5ms }
The first two are exactly what make verify-obi-traces searches for.
Hubble (in the cluster)
1
2
3
4
kubectl --context k3d-lab-ebpf -n kube-system exec ds/cilium -c cilium-agent -- \
  hubble observe --namespace demo --verdict DROPPED
kubectl --context k3d-lab-ebpf -n kube-system exec ds/cilium -c cilium-agent -- \
  hubble observe --namespace demo --to-label app=redis -o compact
ds/cilium picks one agent, which sees only its own node’s flows; the verify-* targets loop over both Cilium pods for that reason.
Signal Timing
| Signal | Path | Delay to expect | Why |
|---|---|---|---|
| Hubble flow | Ring buffer in each agent, read by the UI | Under a second | Nothing to export; the UI streams from Relay |
| Falcosidekick event | Falco → Falcosidekick over HTTP | About a second | Pushed per alert |
| Tetragon or Falco line in Loki | stdout → /var/log/pods → agent collector (tail) → gateway → Loki | A few seconds | File tail, then the collector’s batch |
| OBI span in Tempo | OBI batch → gateway → Tempo; then Tempo’s search index | Up to about a minute before search finds it | OBI’s span batch waits up to 15 s; Tempo’s search lags ingestion further |
| OBI metric in Mimir | OBI pushes every 60 s → gateway → Mimir | 60 to 90 s for a new burst to show | One export per minute, and rate() needs two samples |
| kube-state-metrics, kubelet | Scraped every 30 s by the monitoring pack | 30 to 60 s | Scrape interval |
That table is where each experiment’s wait comes from: 10 to 15 seconds for flows and security events, 60 for traces, 90 for OBI’s metrics. The first capture of Experiment 3 waited only 30 seconds and its panel showed the previous burst, not the new one; and with rate(...[1m]), three of the four OBI panels said No data, because one export a minute never puts two samples inside a one-minute window.
The verify targets cope with the Tempo lag by retrying: make verify-obi-traces searches every 10 seconds for up to two minutes.
Check Your Understanding
A rate(...[1m]) on OBI's counters shows nothing, but [3m] works. Why?
rate() needs at least two samples inside its window. OBI exports metrics once every 60 seconds, so a one-minute window usually holds one sample or none. Three minutes holds about three.
With no traffic at all, the request panel still shows 0.4 req/s for demo/api /healthz. Where from?
The kubelet’s readiness probes: each of the two API pods is probed every 5 seconds, which is 0.2 req/s per pod. OBI sees those requests like any other.
You ran an experiment and the Tetragon panel is empty, but make tetragon-events shows the events. What do you check?
The time range (the panel only shows the dashboard’s window), then whether the agent collector is running on that node (kubectl -n monitoring get pods), then the Loki query in Explore without the line_format and filters, to see whether the raw lines arrived.
Why is a Tempo search slower to find a trace than opening it by ID?
Opening by ID reads the trace from where it was just written. Search uses an index that Tempo builds afterwards, which lagged by up to about a minute in this lab.