OpenTelemetry End to End: Monitor
A tour of the lab's Grafana dashboard, the PromQL, LogQL and TraceQL behind each panel, and how long each signal takes to show up.
Before you start poking the system, learn to read the instruments. This part tours the provisioned dashboard, gives you the handful of Explore queries the experiments use, and explains why a span, a log line and a metric about the same click arrive at different times. That last point saves a lot of “why is it empty?” confusion in Part 6.
Open the Dashboard
Open the homelab’s Grafana, https://grafana.mon.home.cloudutsuk.com, sign in through Keycloak, then Dashboards → Labs → OpenTelemetry lab: static site signals (https://grafana.mon.home.cloudutsuk.com/d/lab-otel-signals). It’s the mon cluster’s Grafana, shared by every homelab cluster, so every query on this page filters on the lab’s cluster, lab-otel.
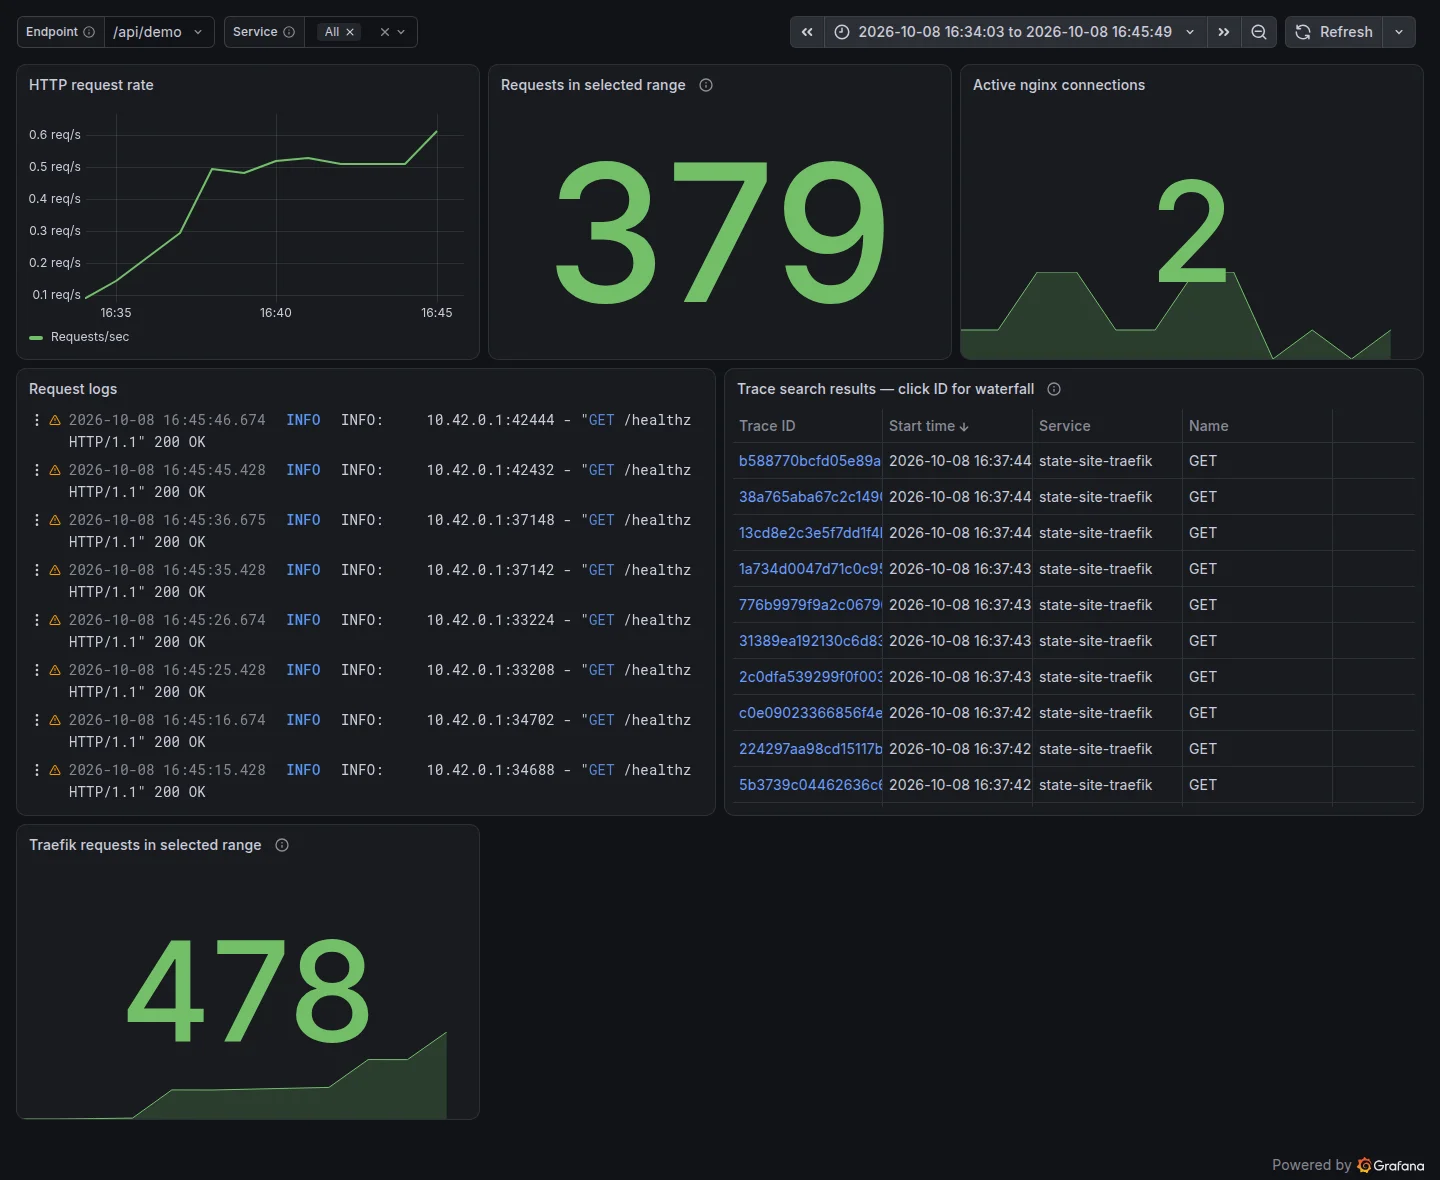 The dashboard as captured right after Experiment 4, with every service selected.
Three controls at the top apply to all panels at once:
- Service filters by
service.name(service_namein Loki, thejoblabel in Mimir). Its choices are the five services:state-site-nginx,state-site-browser,state-site-traefik,state-site-apiandstate-site-backend. Metrics exist only for nginx and Traefik, so picking the API empties the metric panels but not the logs or traces. - endpoint narrows the trace search to a route; it defaults to
/api/demo. - Time range defaults to the last hour, and the dashboard refreshes every 15 seconds.
Panel by Panel
| Panel | Query | What it answers | Normal here |
|---|---|---|---|
| HTTP request rate | sum(rate(nginx_http_requests_total{cluster="lab-otel", job=~"$service_name"}[5m])) | How busy is nginx, smoothed over 5 minutes? | A low, steady line from health probes, bumps when you browse |
| Requests in selected range | sum(increase(nginx_http_requests_total{cluster="lab-otel", job=~"$service_name"}[$__range])) | How many requests did nginx handle in the time picker’s window? | Grows by a few every scrape, even when idle |
| Active nginx connections | sum(nginx_connections_active{cluster="lab-otel", job=~"$service_name"}) | How many connections are open right now? | Between 1 and 4 over the half hour this lab was captured |
| Request logs | {service_name=~"$service_name", k8s_cluster_name="lab-otel"} \| json | What happened, line by line? | nginx JSON access lines, API completion lines, uvicorn access lines |
| Trace search results | TraceQL on service.name and the endpoint | Which traces match? Click an ID for the waterfall | One row per request to /api/demo |
| Traefik requests in selected range | sum(increase(traefik_entrypoint_requests_total{cluster="lab-otel", job=~"$service_name"}[$__range])) | How many requests entered the cluster? | Counts page loads, API calls and the browser’s exports |
Two things in this table become lessons later:
- “Normal” is never zero. nginx’s counter comes from
stub_status, which counts every request, including the kubelet’s/healthzprobes (readiness and liveness, every 10 seconds each) and the browser’s span exports to/v1/traces. The access log skips both (access_log offon those locations). Metrics and logs can disagree about “how many requests” and both be right. - The Traefik panel sits below the fold. Grafana renders panels lazily, so scroll down or it may stay empty.
Explore Queries
Explore (the compass icon) is where you ask your own questions. These are the queries the experiments use; each was run against this lab while writing it.
TraceQL (Tempo)
| Query | Returns here |
|---|---|
{ resource.k8s.cluster.name = "lab-otel" && name = "sqlite SELECT records" } | Traces that missed the cache and read SQLite |
{ resource.k8s.cluster.name = "lab-otel" && name = "GET (cache hit)" } | Traces served from Redis |
{ resource.k8s.cluster.name = "lab-otel" && resource.service.name = "state-site-browser" } && { name = "sqlite SELECT records" } | Only browser-started misses: two conditions on different spans of one trace |
{ resource.k8s.cluster.name = "lab-otel" && status = error && resource.service.name = "state-site-api" } | Requests that failed in the API (experiment 6) |
{ resource.k8s.cluster.name = "lab-otel" && span.http.response.status_code = 502 } | Gateway spans that returned 502 (Traefik uses the newer attribute name) |
You can also paste a trace_id from the API’s JSON response straight into the Tempo query box.
LogQL (Loki)
| Query | Returns here |
|---|---|
{service_name="state-site-nginx", k8s_cluster_name="lab-otel"} \| json \| uri="/" | Page loads only, with the JSON fields parsed into labels |
{service_name="state-site-api", k8s_cluster_name="lab-otel"} \|= "api.demo.completed" | One line per successful API call, carrying trace_id and cache_source |
{service_name="state-site-api", k8s_cluster_name="lab-otel"} != "/healthz" | API logs without the probe noise |
PromQL (Mimir)
| Query | Returns here |
|---|---|
sum by (code) (rate(traefik_entrypoint_requests_total{cluster="lab-otel", job="state-site-traefik", method="GET"}[1m])) | Requests per second entering the cluster, split by status code |
sum by (code, method, job) (traefik_entrypoint_requests_total{cluster="lab-otel"}) | The raw counters; on this run: 200 GET 92, 200 POST 33, 404 GET 18, 304 GET 7, 502 GET 4 |
rate(nginx_http_requests_total{cluster="lab-otel", job="state-site-nginx"}[1m]) | nginx’s own request rate, from the scraped exporter |
The POST 200s in that list are the browser’s span exports to /v1/traces, which pass through Traefik on their way to nginx. The 404s are mostly /favicon.ico, which the site doesn’t have.
Signal Timing
A click is instant; its evidence isn’t. Each signal waits in a different queue:
| Signal | Delay before it can arrive | Where the number comes from |
|---|---|---|
| Browser spans | up to 2 s | scheduledDelayMillis: 2000 in otel.js |
| Server spans (nginx, Traefik, Python) | about a second | SDK batch processors + the Collector’s batch processor |
| Spans findable by search | observed up to about a minute | Tempo indexes recent traces for search after ingesting them; opening a trace by ID works sooner |
| nginx metrics | up to 15 s, then one more scrape for a rate | scrape_interval: 15s in the Collector |
| Traefik metrics | observed within about 14 s of a burst | Traefik pushes OTLP metrics on its own interval |
| Logs | a few seconds | written to stdout, then tailed from /var/log/pods |
| The dashboard | up to 15 s more | "refresh": "15s" in the dashboard JSON |
Every experiment in Part 6 has a wait sized from this table, and every make verify-* target keeps asking for up to a minute before it reports failure. When a panel looks empty, check the time picker first, then give it one more refresh.
Check Your Understanding
The Requests stat rose by 7 after one page load that fetched three files. Is something wrong?
No. stub_status counts every request nginx handles, including health probes and the browser’s /v1/traces exports, and the stat covers whatever happened between two scrapes. The access log, which excludes probes and exports, is the place to count the page’s own files.
You made a request 10 seconds ago and TraceQL search can't find it. What do you try?
Wait and search again: Tempo’s search index lags behind ingestion. If you have the trace_id (the API returns it), paste it into the query box to open the trace directly.
Why do POST requests show up in Traefik's metrics when the app only has GET endpoints?
They’re the browser SDK exporting spans to /v1/traces. Those requests enter the cluster through Traefik like any other, so Traefik counts them, even though nginx neither traces nor logs them.