OpenTelemetry End to End 7
Follow one click from the browser through nginx, Traefik, a FastAPI API, a backend with Redis and SQLite, and into traces, logs and metrics in Grafana, all on a local k3d cluster.
Parts
What you build, what you need, and how requests and signals travel through it.
The application and its instrumentation, file by file.
The cluster, the app manifests and the observability stack that receives the signals.
Bring everything up, check the rollout and smoke-test the endpoints.
A tour of the dashboard, the query behind each panel, and how long each signal takes to arrive.
Perform an action, predict the signal, then check the dashboard and explain what changed.
What the experiments proved, where this setup stops, and what production would change.
Experiments
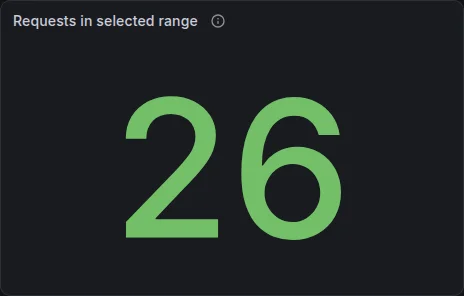
See one page load turn into nginx requests, JSON access-log lines and a browser documentLoad trace.
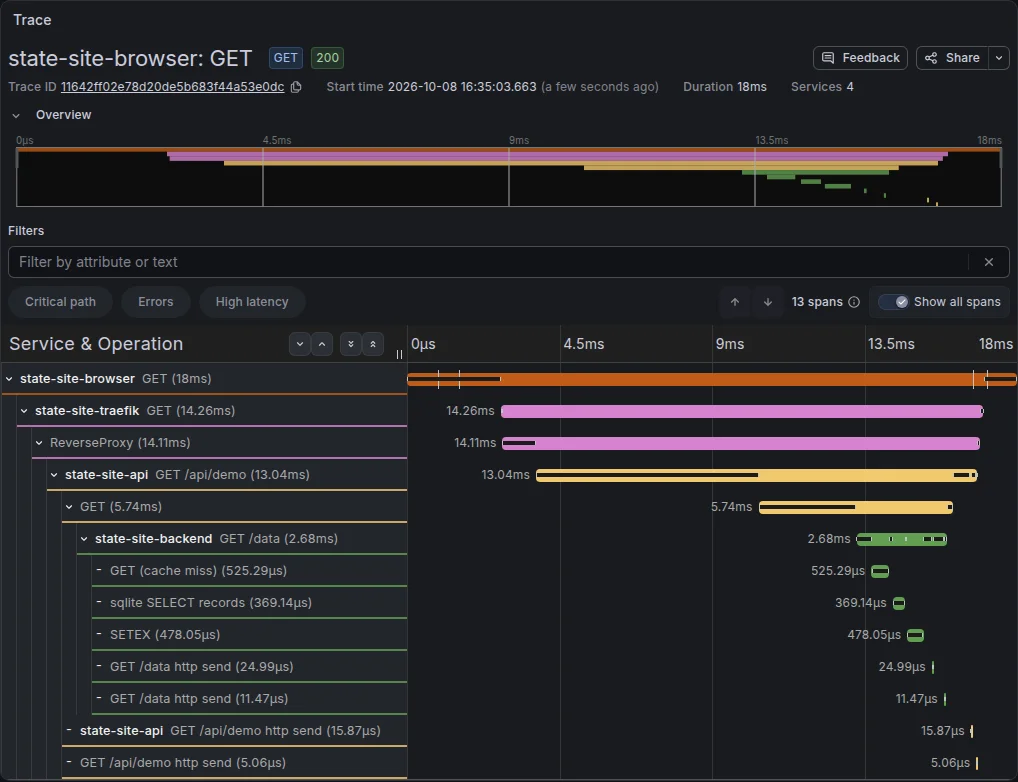
Watch one click cross four services in one trace (browser, Traefik, API, backend), and see the backend fall back to SQLite when Redis has no copy.
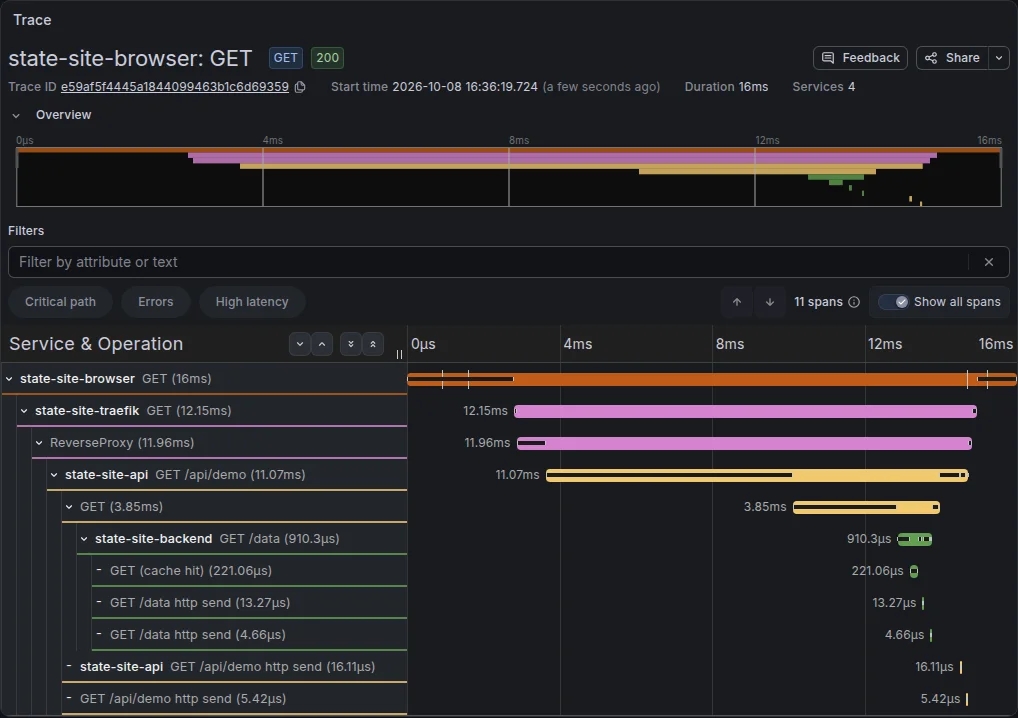
Run the same request with a warm cache and spot what disappears from the trace.
See Traefik's request metrics climb while 150 requests arrive, and how pushed metrics differ from scraped ones.
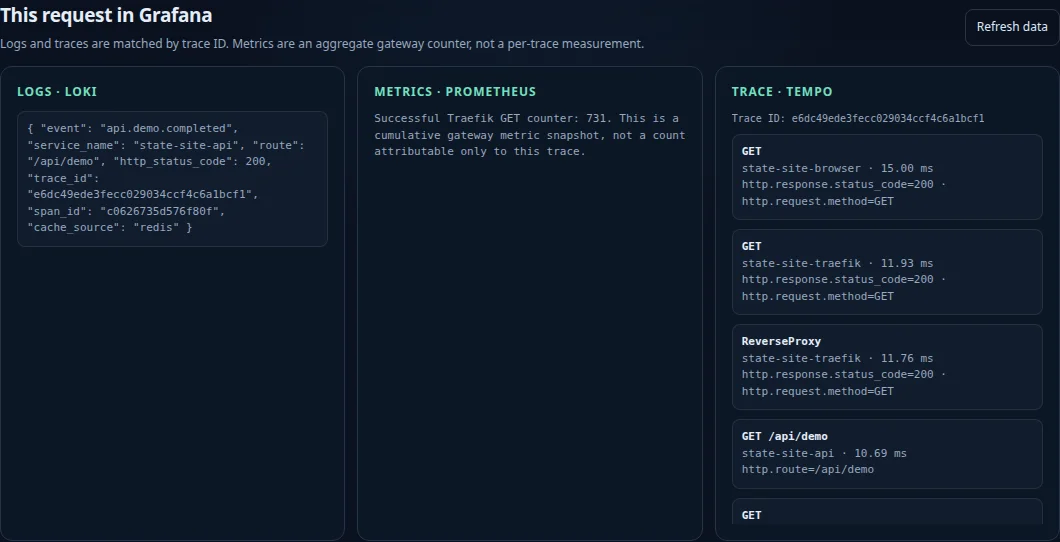
Use the trace ID in the API's log line to find the exact trace, the way the lab page does it.
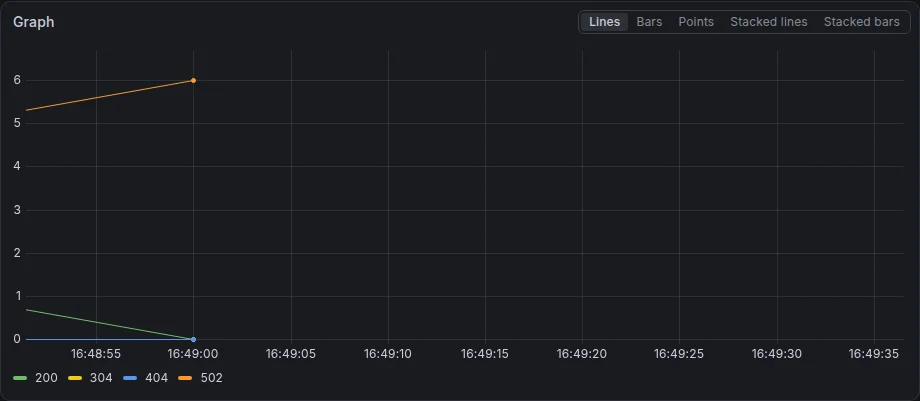
Stop the backend, watch errors show up in all three signals, then watch it recover.