Cloudutsuk Platform: Operations and Observability
Monitoring, logs, traces, alerts and the targets the service is held to for Cloudutsuk Platform.
Every cluster on the DGX, a short-lived lab included, sends its metrics, logs and traces to one place, the mon cluster, and every alert reaches the same Slack channel. That was Phase 2’s promise, and it’s how the platform runs now (2026-10-15): one Grafana with 32 dashboards, 195 rules, 15 days of everything. The decision that shaped it was to collect with OpenTelemetry but keep Prometheus names (ADR 0026), so the community’s dashboards and alert rules work unchanged instead of being rewritten.
Application and infrastructure monitoring
There are three layers, and each has its own collector:
| Layer | What collects it | What it covers |
|---|---|---|
| The DGX host | Host containers from the infrastructure repo, on the homelab bridge | node-exporter (CPU, memory, temperatures, disks, network), DCGM (the GB10 GPU), Docker cAdvisor (memory per container, so per k3d cluster), process-exporter (memory and CPU per process name), blackbox (probes) |
| Each cluster | The monitoring pack, installed by an Argo CD ApplicationSet on every cluster, labs included | An OpenTelemetry agent per node (kubelet and cAdvisor, pod logs, apps’ OTLP), a cluster collector with a target allocator (kube-state-metrics, the API server, every ServiceMonitor and PodMonitor), Kubernetes events as logs |
mon | An OTLP gateway behind otlp.mon.home.cloudutsuk.com | Accepts each cluster’s data with that cluster’s bearer token (labs share one), then writes to Mimir (metrics), Loki (logs) and Tempo (traces) |
k3d nodes are containers, so a cluster can’t see the host’s real memory or the GPU. That’s why the host has its own exporters, labelled cluster="dgx". Everything else carries the cluster’s name, so one dashboard covers every cluster with a drop-down (ADR 0042).
Platform components report through their charts’ own metrics endpoints: Argo CD, External Secrets, cert-manager, Kyverno, Traefik, Velero and the collectors themselves. Turning on a chart’s serviceMonitor is all it takes; the target allocator finds it.
Labs get the same pack under lab contract v2: make up registers the lab with Argo CD, which installs the pack. The lab’s signals show up in mon without the platform knowing anything about the lab.
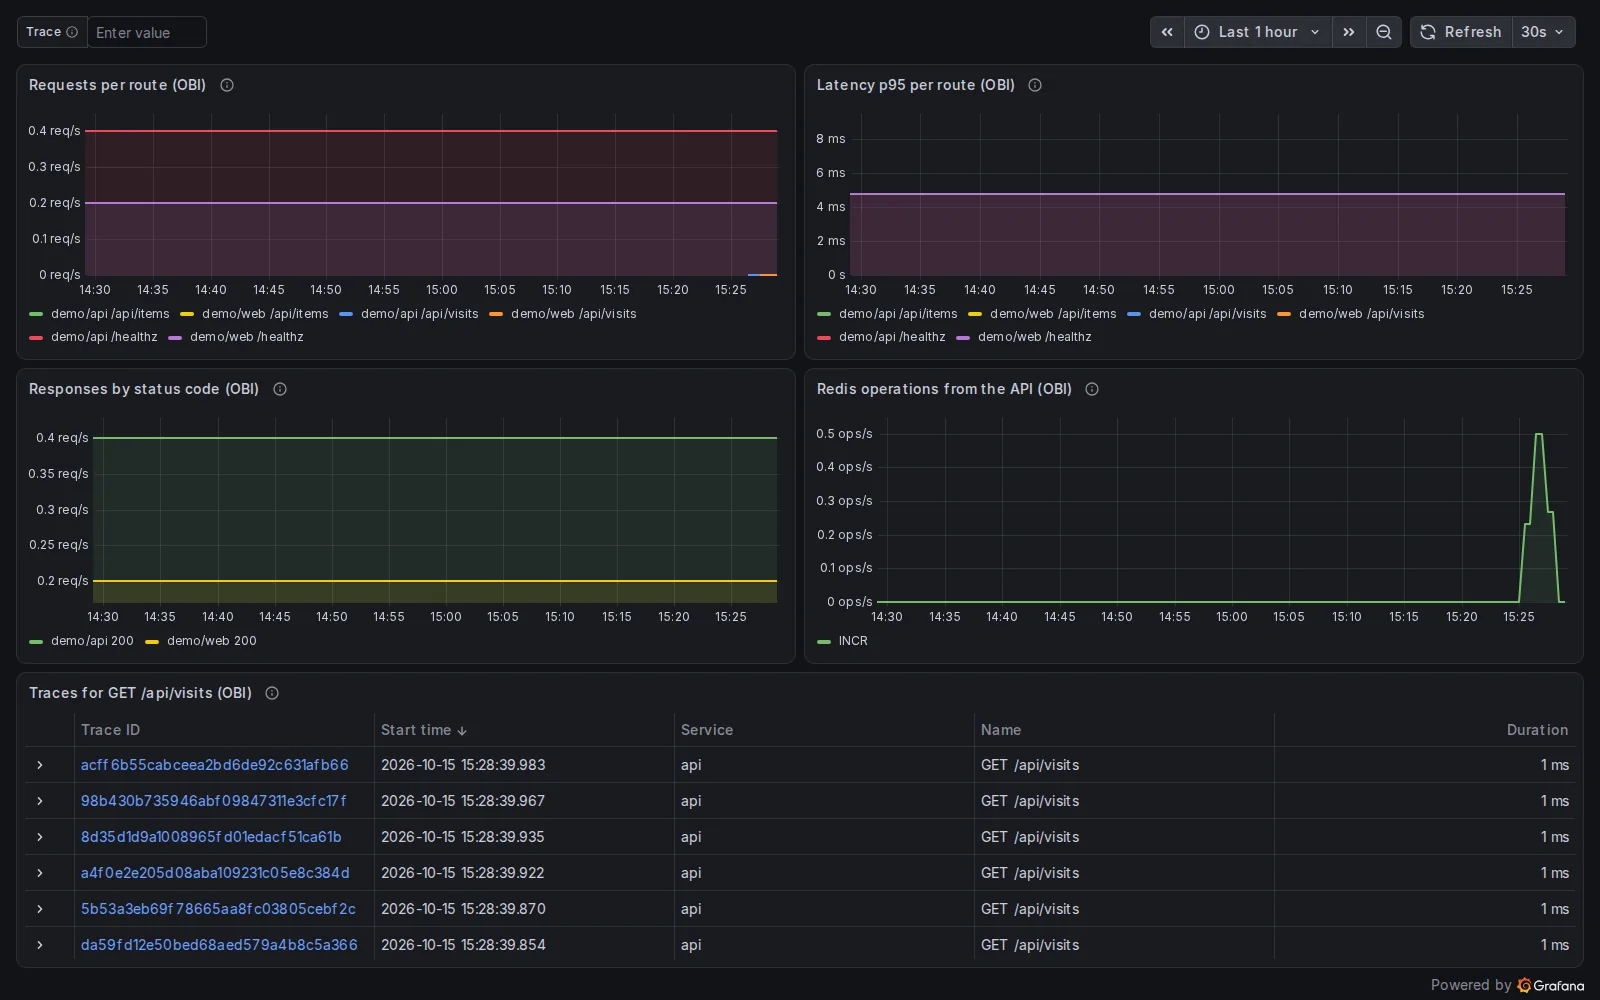 The eBPF lab’s dashboard in
mon: OBI measures requests and traces with eBPF, the lab’s collector forwards them, and lab.sh loaded the dashboard into the Labs folder when the lab registered.
Logging and log retention
- Pod logs: the agent collector on each node tails
/var/log/pods, adds the pod’s labels, and ships them to Loki. Nothing in an app has to change; anything written to stdout is collected. - Kubernetes events go to Loki too, from the cluster collector, so “why did this pod restart” has an answer after the event has expired from the API.
- Labels: every stream has
k8s_cluster_name,k8s_namespace_name,k8s_pod_nameandservice_name. Queries filter on the cluster first, because Loki holds every cluster’s logs. - Retention: 15 days, enforced by Loki’s compactor, on a host folder that outlives the cluster. That’s enough to look back over a sprint of work. Anything that needs to live longer belongs in a ticket or a lesson, not in logs.
Loki uses
k8s_cluster_namefor the cluster label, while Mimir usescluster. That’s the OpenTelemetry-to-Loki translation, not a choice. Dashboards and lab checks use each store’s own name.
Metrics and dashboards
Metrics live in Mimir for 15 days. Dashboards are code: vendored, version-pinned JSON in the GitOps repo, loaded by Grafana’s sidecar, and read-only in the UI (ADR 0027). Every one has a data source and a cluster variable.
| Folder | Dashboards | Source |
|---|---|---|
| Fleet | DGX Spark host; node-exporter Nodes and USE method | Written here; node-mixin |
| Kubernetes | 16: compute resources (multi-cluster, cluster, namespace, node, pod, workload), networking, kubelet, API server, persistent volumes | kubernetes-mixin |
| Platform | Argo CD, External Secrets, Kyverno, Traefik, cert-manager, Velero backups, OpenTelemetry collectors | Upstream, plus two written here |
| AI | GPU (DCGM), vLLM, LiteLLM gateway | Upstream; LiteLLM fills in Phase 5 |
| Labs | One per running lab, loaded when the lab registers and removed when it leaves | Each lab’s repo |
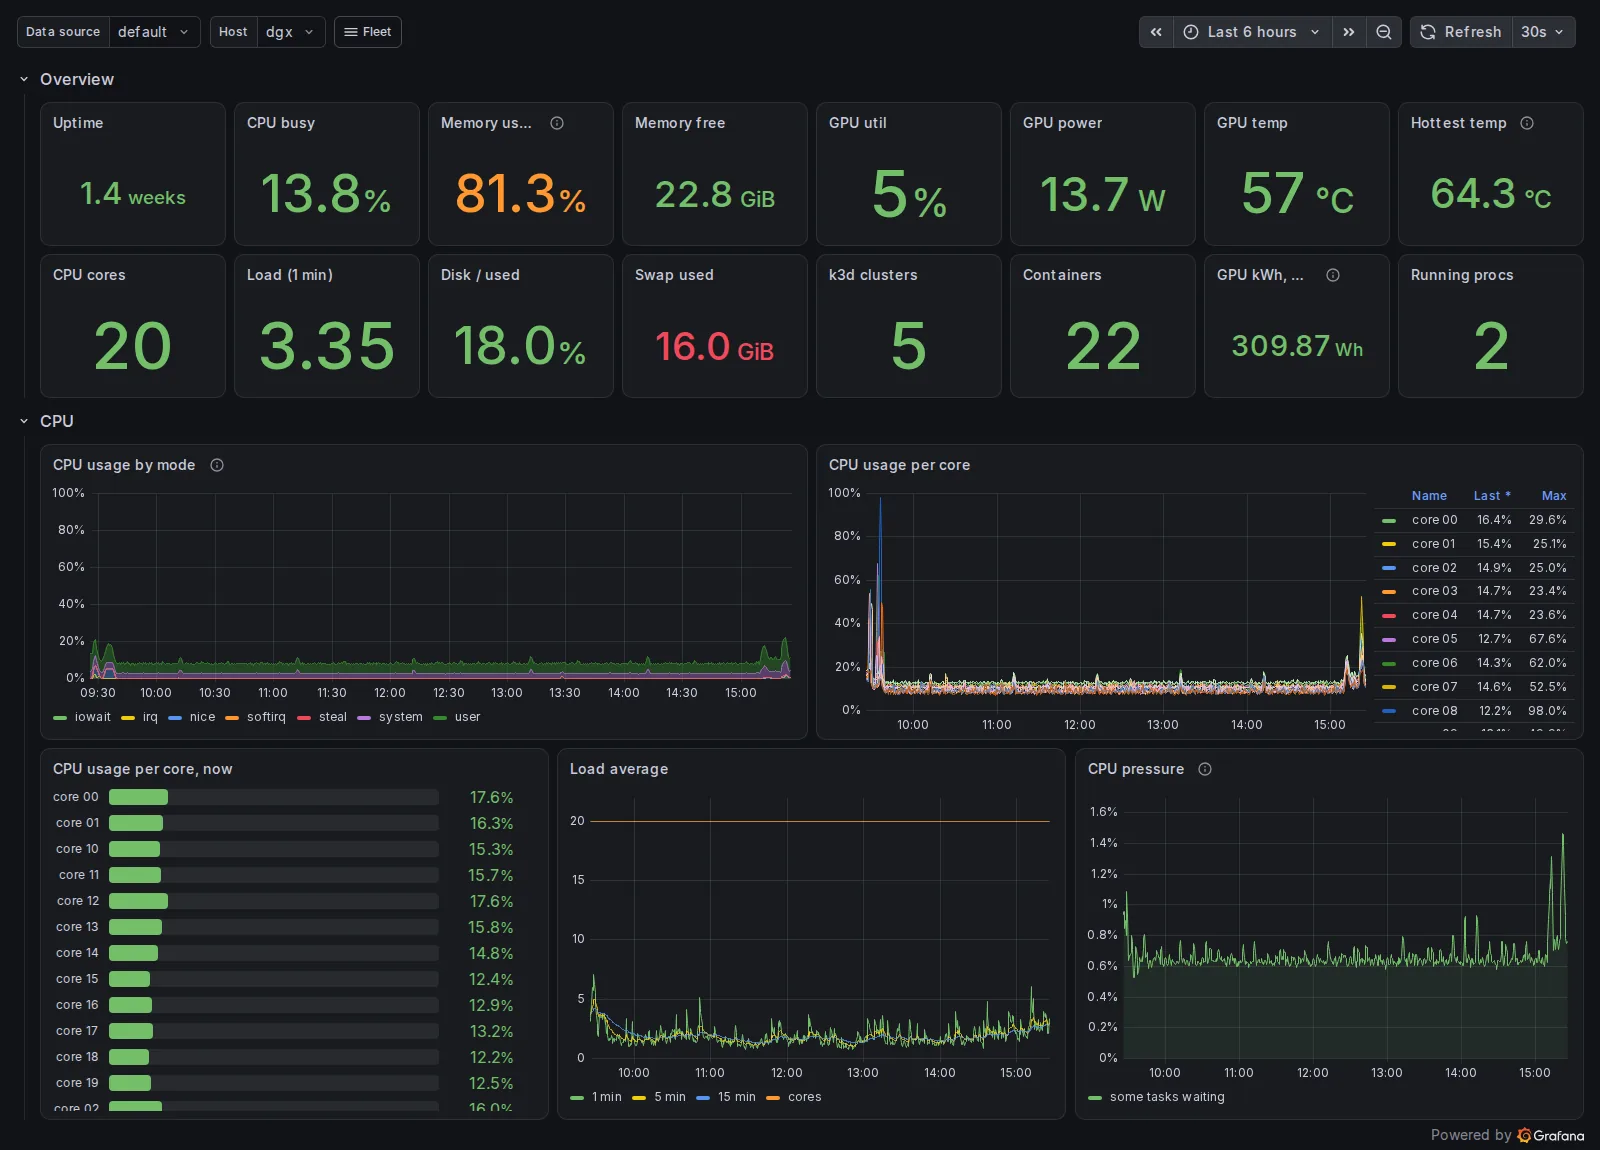 Fleet / DGX Spark host: the one machine everything runs on. Memory per k3d cluster, the top processes, temperatures and the GPU are further down.
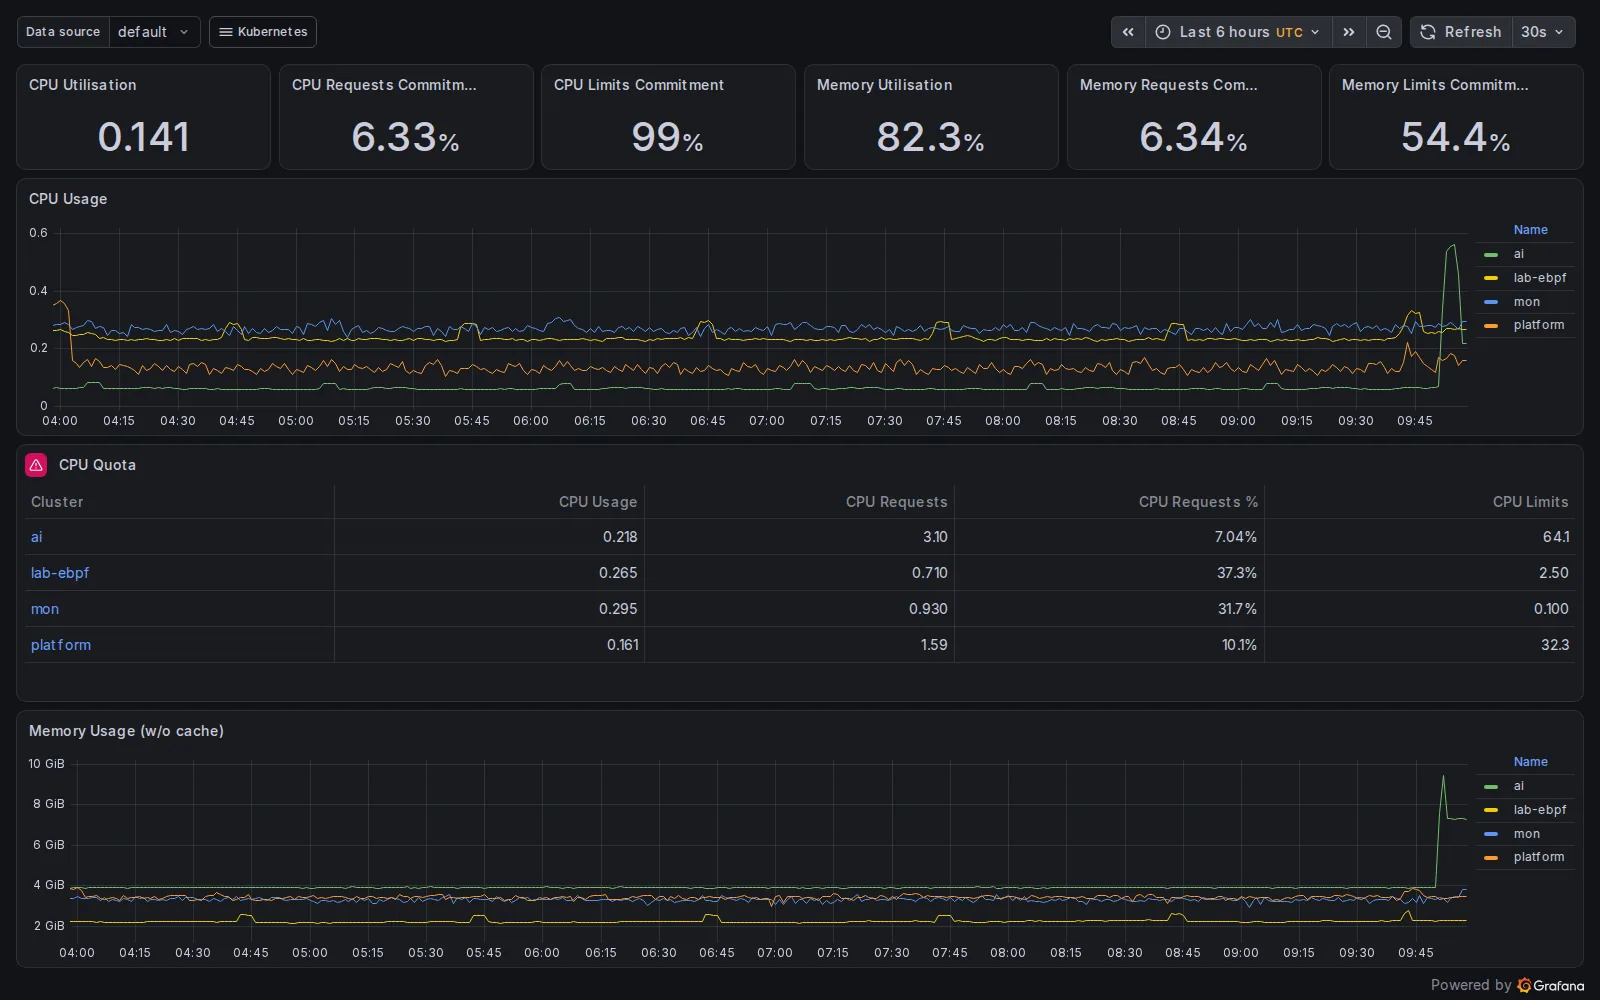 Kubernetes / Compute Resources / Multi-Cluster: every cluster on one page, from the mixin, unchanged.
Empty panels are checked, not ignored. A script runs every panel’s query for every cluster and lists the ones with no data. The ones that are empty by design (no CPU limits are set anywhere, LiteLLM isn’t deployed yet) are listed with the reason, so a newly empty panel stands out.
Distributed tracing
Apps send OTLP to the agent collector in their own cluster, which forwards to Tempo through the gateway. Traces are kept for 15 days.
What sends traces today:
- The labs. The OpenTelemetry lab instruments a static site end to end, browser to backend. The eBPF lab gets traces with no instrumentation at all: OBI watches the app’s network calls with eBPF and builds spans from them.
- Not yet: the platform’s own services (the portal, the lab runner, the inventory) don’t emit traces. That comes with their OTel SDK setup. The RAG pipeline gets Phoenix for LLM-specific traces in Phase 5 (ADR 0021).
TODO: Trace the portal and the lab runner (OTel SDK), so a slow lab deploy can be followed from the click to the
makerun. Planned with Phase 3a’s quality baseline.
Health checks
Health is checked at four levels, each catching what the one before can’t:
| Level | How | Catches |
|---|---|---|
| Container | Readiness and liveness probes on every workload (Kyverno requires the security settings, the charts bring the probes) | A process that’s up but not serving |
| Deployment | PostSync smoke tests: a Job Argo CD runs after every sync (hello-world, the portal) | A rollout that’s “Healthy” but broken |
| Endpoint | The blackbox exporter probes 7 URLs every minute: the public blog, Grafana, Argo CD, Keycloak, OpenBao, the registry and the Velero UI. It also tracks certificate expiry | A service that’s down from the outside, or a certificate about to lapse |
| Cluster | Popeye scans every cluster read-only and grades it (all five scored B, 82–87, on 2026-10-15); the homelab link page checks every link’s status code and certificate | Misconfiguration and drift that no alert covers |
The smoke tests matter most. A pod can pass its probes while the app is serving the wrong config. The portal’s test checks the frontend carries the homelab’s settings and the API answers 401 without a token.
Alerting and escalation
Rules live in Mimir’s ruler, as code next to the dashboards: 195 rules, 118 of them alerts. They come from the kubernetes-mixin and node-mixin, the cert-manager mixin, and rules written here for the GPU, vLLM, the blackbox probes, the platform components and a Watchdog.
1
2
3
Mimir ruler ──> Alertmanager (in mon) ──┬── warning, critical ──> Slack
                                        ├── Watchdog, every minute ──> healthchecks.io
                                        └── none, info ──> nowhere
- Routing: warnings and critical alerts go to Slack, grouped, with a 4-hour repeat. Severity
noneandinfogo nowhere; they exist for dashboards. - Dead man’s switch: the Watchdog alert always fires and pings healthchecks.io every minute. If the pings stop, because Mimir, Alertmanager or the whole DGX is down, healthchecks.io emails. It’s the one alert that works when nothing else does.
- Where to look: Grafana’s Alerting pages need the Alertmanager data source picked; Grafana’s own built-in Alertmanager is unused and shows no contact points. A small Job loads the config into Mimir’s Alertmanager through its API after every sync and hourly, so Grafana can show it. The config lives in Git and the secret store, so an edit made in Grafana’s UI is overwritten within the hour.
- Escalation: there’s one person on call, so escalation is “Slack, then email from healthchecks.io”. In Phase 6 an SRE agent joins the same webhook to draft a root-cause analysis for each alert.
Proved at the Phase 2 exit (2026-10-15): a test pod on ai that crash-loops on purpose raised KubePodNotReady once its 15-minute for: had passed, then KubePodCrashLooping five minutes later, both routed to Slack. Deleting the pod cleared both within six minutes.
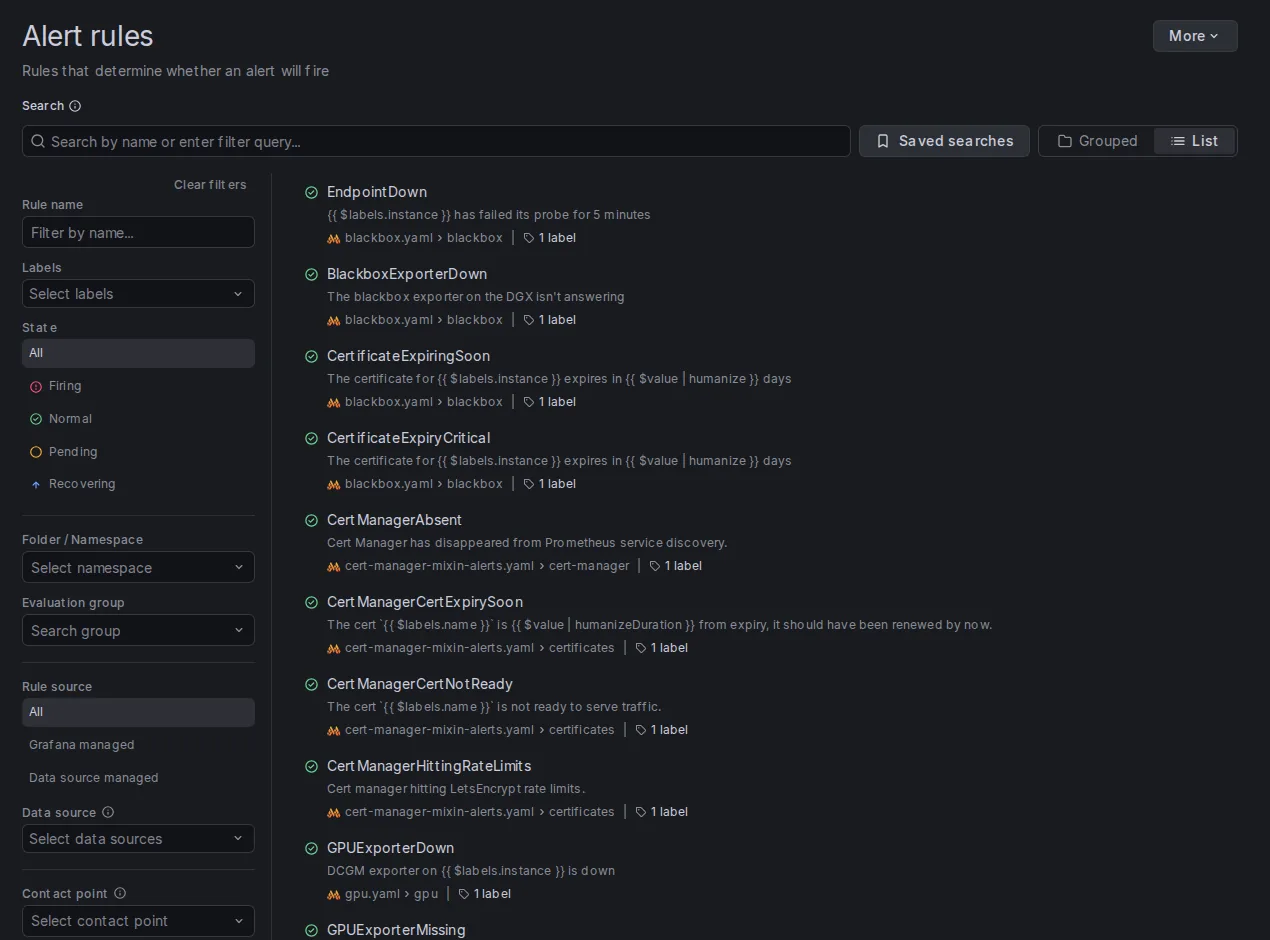 Grafana’s alert rule list reads Mimir’s ruler: every rule, its file and its state.
Availability and performance targets
The targets are proposed, not yet held (ADR 0020):
| Target | Initial value |
|---|---|
| Portal availability | 99% per month |
| Chat, time to first token | under 3 s at p95 |
| Alert to root-cause analysis | under 5 minutes (Phase 6) |
They stay proposed until Phase 3a’s first load baseline shows what the hardware actually does. A target set before the first measurement is a guess, and an SLO built on a guess pages for the wrong things.
TODO: Set the SLO targets from the Phase 3a baseline, add burn-rate alerts, and accept ADR 0020.
Operational runbooks
- Alerts link to runbooks. 63 of the alerts (the mixins’ and cert-manager’s) carry a
runbook_urlto their upstream runbook. The rules written here describe the fix in their description. - Procedures live next to the code. Each repo’s README has the operational steps for what it owns: restarting a k3d node without losing its host aliases, unsealing OpenBao, re-registering a lab, rotating a token, rescanning a cluster. The boot unit is the runbook for a reboot, as code.
- The lessons log is the runbook for the unexpected. Every problem that cost real time is written up with symptom, cause, fix and lesson (Lessons Learned).
TODO: Runbook pages for the rules written here (GPU, vLLM, platform), linked from each alert’s
runbook_url.
Incident and problem management
An incident here is “an alert fired, or something visibly broke”. The flow is short because the team is one person:
- Detect: Slack, healthchecks.io, or a red tile on the homelab link page.
- Mitigate: restore service first. The fix is a commit (GitOps) wherever possible, so it’s reviewed and reversible.
- Learn: if it cost real time, a lesson with the root cause. Two from this phase:
- Mimir was OOM-killed in a loop after a routine restart: the ingester’s catch-up after downtime needs far more memory than steady state (L053).
- DNS over UDP filled
core’s k3d load balancer and took Keycloak, OpenBao and the registry down with it (L068; written up as a separate post).
Problem management is the lessons log plus the roadmap: a lesson whose fix is bigger than a commit becomes a step in a phase.
Capacity and cost monitoring
Memory is the constraint on a single DGX with 128 GB of unified memory: the GPU shares it.
- Per cluster: Docker cAdvisor’s working set per k3d node container is the cluster’s real memory use. The DGX dashboard shows it stacked, next to the top processes on the host.
- Admission control: the lab runner refuses a lab deploy that would leave less than 25 GB free (
MemAvailable, because GPU memory isn’t charged to containers) (ADR 0017). - Pressure, not just usage: Linux pressure stall information for CPU, memory and I/O is on the dashboard. Swap is too: the first look at the new dashboard showed it nearly full, a warning no usage graph had given.
- Energy: DCGM reports the GPU’s energy; the dashboard shows kWh per hour and per day. The DGX doesn’t expose the whole system’s power to Linux.
TODO: Cost. Phase 4 adds OpenCost on every cluster with DGX prices, and cloud costs per lab, in the portal.
Checklist
- Every cluster, labs included, sends metrics, logs and traces to
monwith its cluster label - The DGX host’s own metrics: CPU, memory, temperatures, GPU, network, disks, processes
- Dashboards as code, version-pinned, with a cluster variable; empty panels explained
- Alert rules as code; warnings and critical alerts reach Slack; the Watchdog reaches healthchecks.io
- A pod that crash-loops on purpose fires an alert, and it clears when the pod goes
- 15 days of metrics, logs and traces, on storage that outlives the clusters
- SLO targets set from a measured baseline, with burn-rate alerts (Phase 3a)
- Traces from the platform’s own services (portal, lab runner)
- Runbook pages for the alert rules written here
Cost per cluster and per lab (Phase 4)